Strange Attractors
Here is the content of my poster presented at FHSU.
Abstract
Strange attractors are created when a chaotic system forms a repetitive pattern in which the points “attract” towards each other. These attractors can be represented as images of points on a Cartesian plane. My findings show that there are a number of visual categories the images created can be sorted in. By using the TensorFlow python libraries, I was able to sort these images using machine learning. This forms one of many examples on how Tensorflow can be used. Though the chaotic nature of these images appears to be sudo-random, analysis indicates that some variable tendencies appear in different places on the quadratic mapping equation for categories of images.
Methods
- Creation of The Images
- The overall process is that I create 12 random constants and use a quadratic map with those constants to create “strange attractors.” Very certain combinations of constants in (Equation 1) inhibit chaos and some form attractors when the points seem attracted to a certain pattern.
- I used the error checking method described by Ian Withan that checks for index errors. I also used J. C. Sprott’s (1998) naming method that matches 25 numbers between -1.2 and 1.2 with letters (p. 53).
- Colorization
- Using Ian Withan’s (2009) method of coloring each pixel with the x value of its parent pixel, I was able to create images that also described the chaotic nature of the parent-child relationship.
- Histogram Equalization – Based on Withan‘s Code (2009)
- Using scipy.hist(), I first create a histogram describing the frequency of certain color values from the flattened image array.
- Then using a cumulative sum function I am able to more evenly distribute the histogram values.
- I then scale the cumulative sum function so that the max value is 255.
- Using scipy’s interpolation function I remap the equalized histogram to the image array.
- I then reshape the array to the original dimensions.
- Manual Sorting of Images
- Sorted the images into these categories: a_shape, funnel, multi, particle, shell, tshape, and other.
- Automatic Sorting of Images
- Used the Tensorflow (Abadi, 2017) ImageNet model and retrained the last layer to categorize my images.
- Ran the model and sorted images based on a degree of accuracy for the model
- Analysis of Images
- Created analysis.py that counts all the values that occur in each location and uses basic statistics to tell how each variable weights
- Used my analysis.py program to test which variables weight to which categories.
Results
Darker colors indicate more even dispersal. Brighter red indicates a tendency towards. Brighter blue indicates a tendency away. Dash indicates no instances.
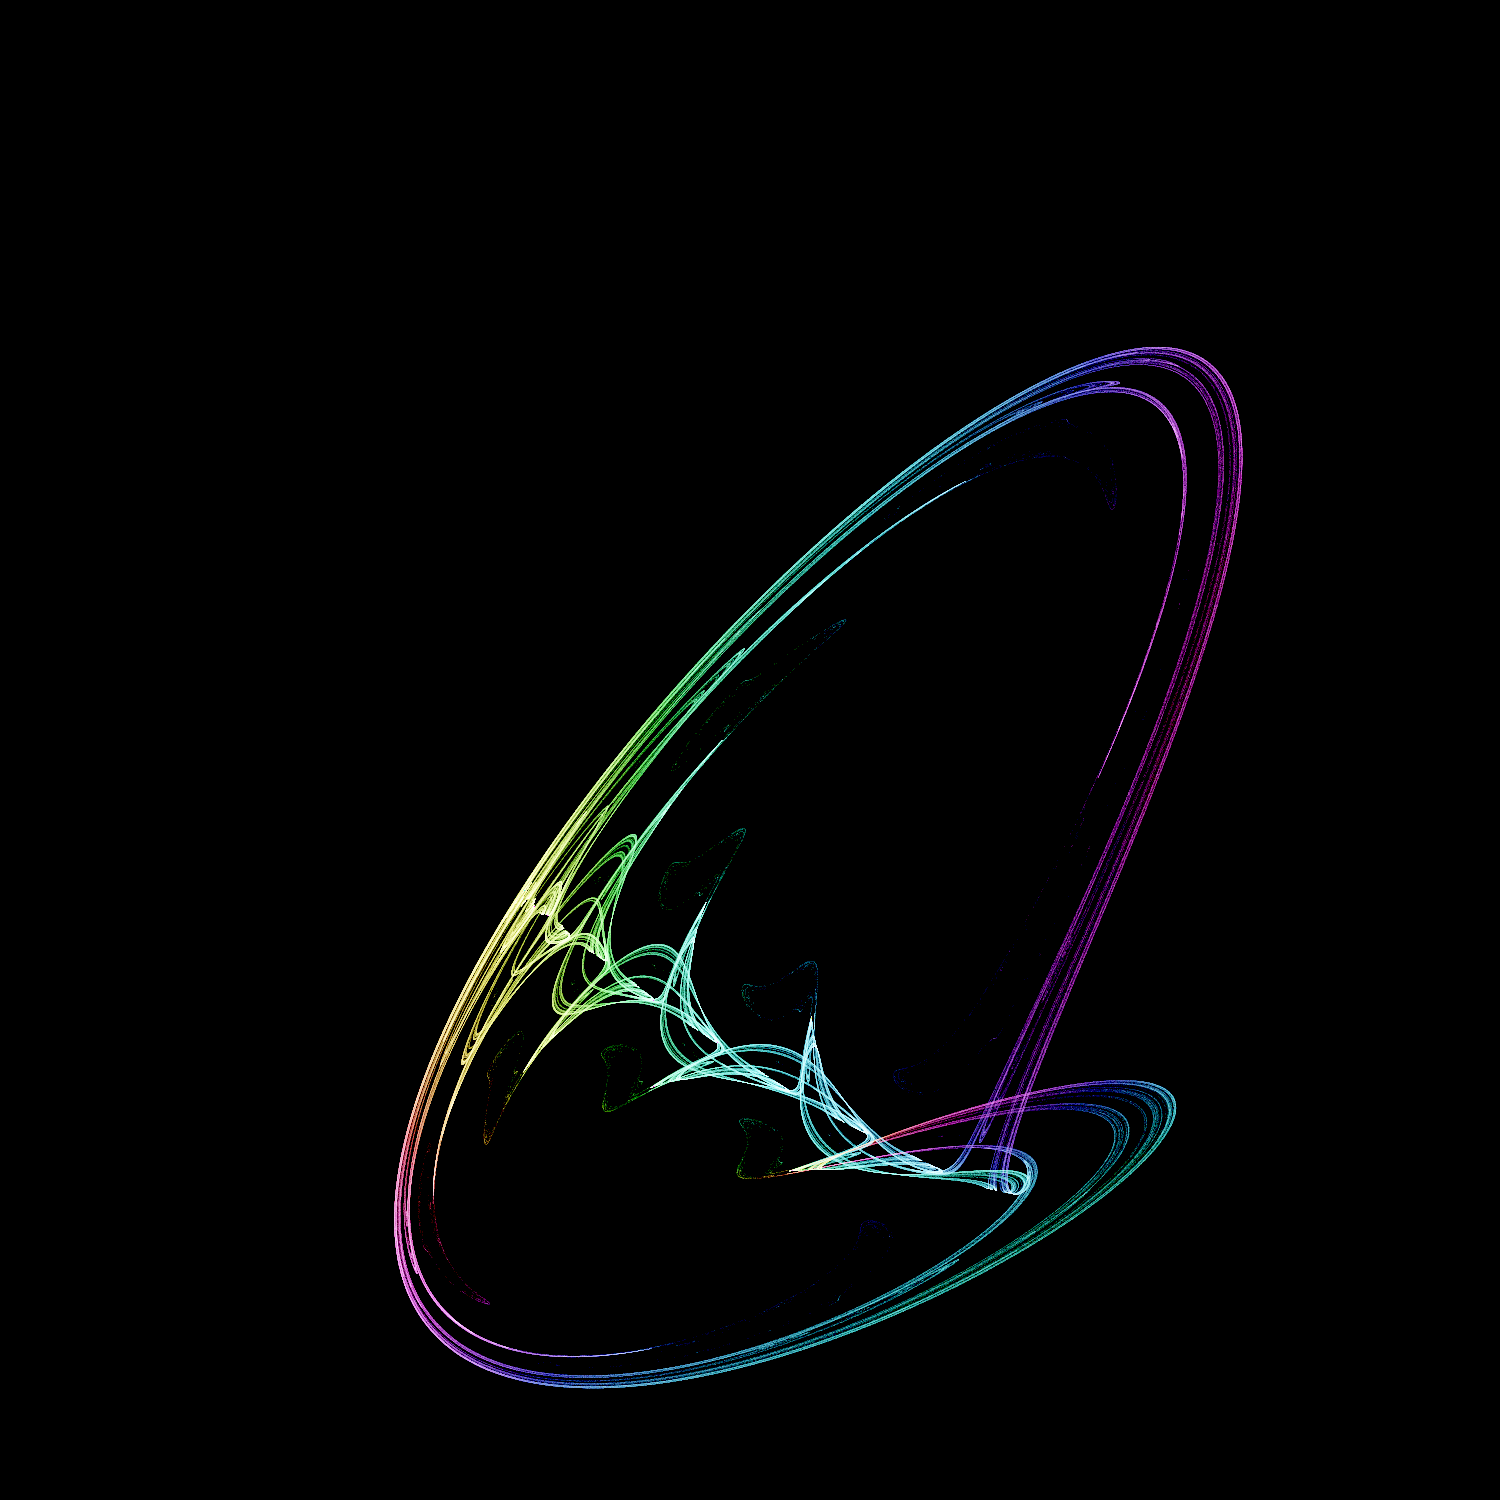
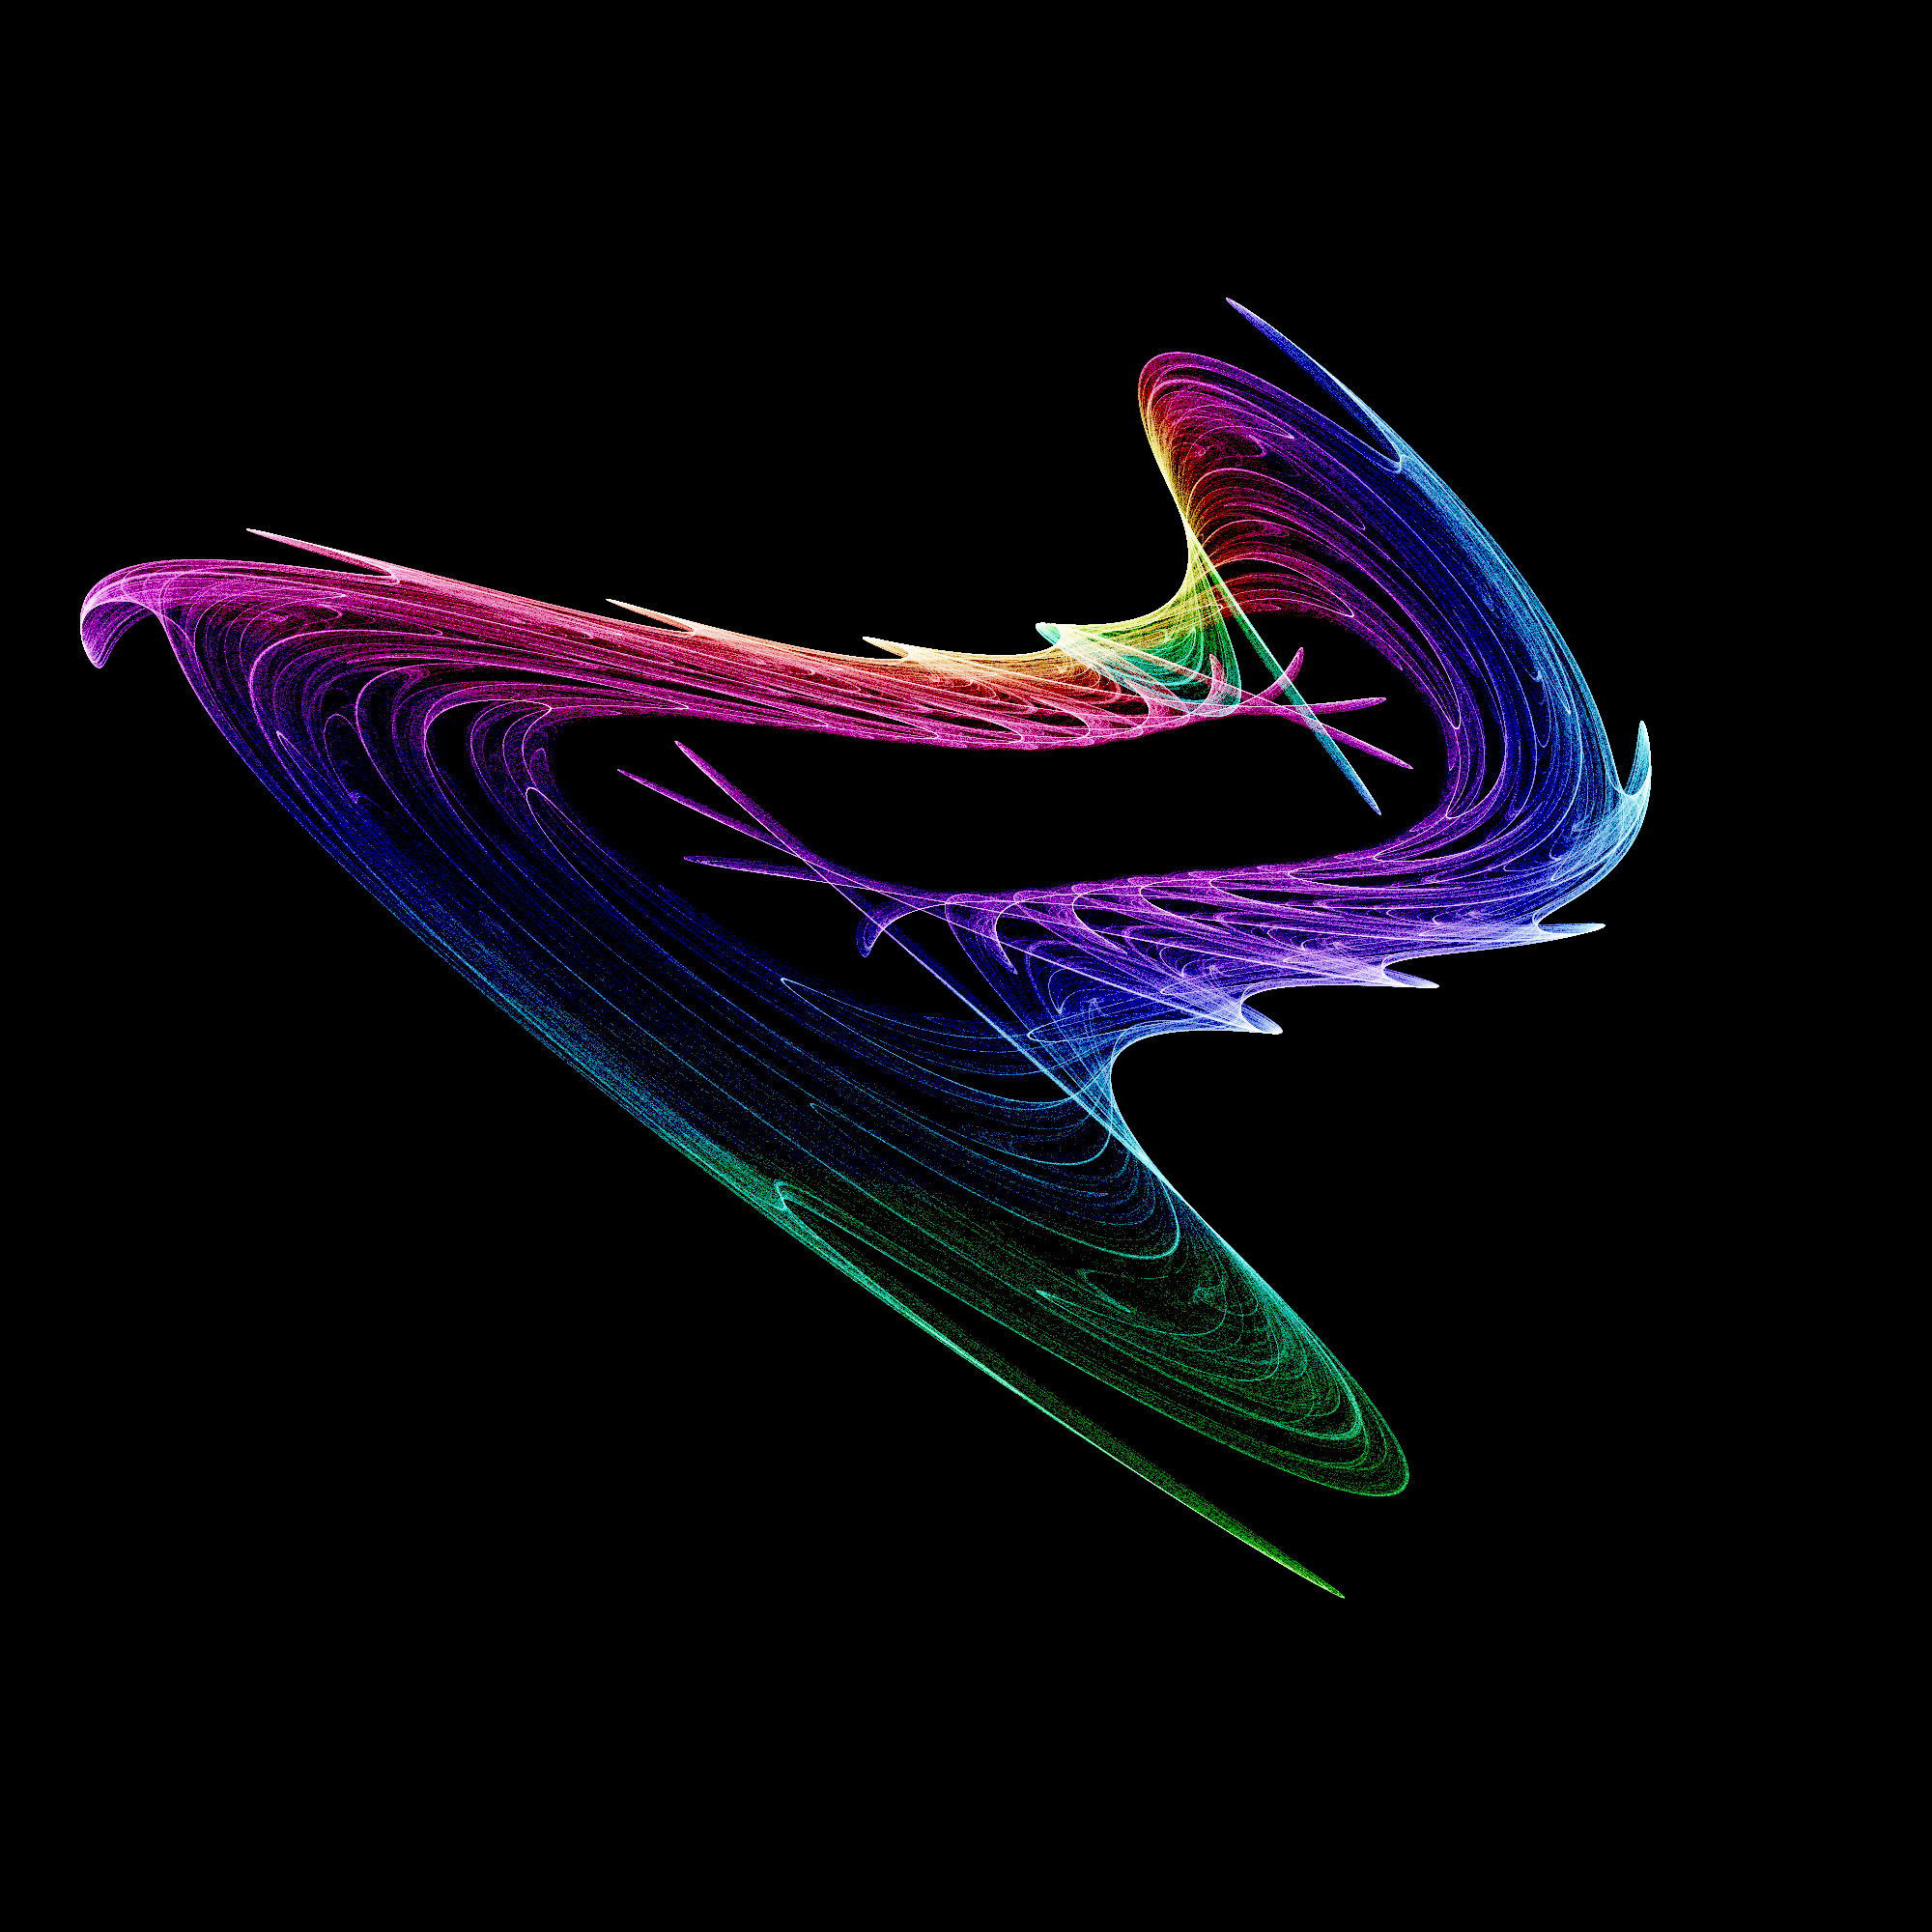
Some examples of images created
 An example of a t-shape attractor.

Other pictres can be found in the Images folder.
Discussion/Conclusion
It appears that there is a strong tendency for the variables but more data is needed. The variables on all the attractors tend to have the most weighting in the extremes and the fourth and tenth spaces have little variance (Figure 2). The tshape category, however, has distinct variable weightings (Figure 3). Figure 1 acts as a control for the random generator. Using 16 bit color depth would have been beneficial due to only 255 levels of brightness and the widely skewed histogram before equalization. A downfall of my project was that attempted recreation of example attractors from J. C. Sprott’s (1998) paper throws errors (p. 54). However, all of my images are repeatable and the program runs fast enough for 2000 renders in about 4-5 hours on outdated hardware. The Tensorflow (Abadi, 2017) model initially had a 77% accuracy rate but I successfully brought it up to 92% for one category. More work can be done to improve on my findings. One could make a description on how the categories relate to each other. One could also recreate my python program to be able to use user-defined quadratic mapping equations.
References
Abadi, M., Agarwal, A., Barham, P., Eugene, B., Chen, Z., Citro, C., . . . Zheng, X., (2017) TensorFlow: Large-scale machine learning on heterogeneous systems (Version 1.0.0) [Software]. Available from: tensorflow.org
Iam Whitham. (2009). The pragmatic procrastinator. [Web log comment]. Retrieved from https://ianwitham.wordpress.com
Sprott, J. C. (1998). Automatic generation of strange attractors. In C. A. Pickover (Ed.), Chaos and fractals: a computer graphical journey (pp. 53-60). Amsterdam, The Netherlands: Elsevier science B.V.
