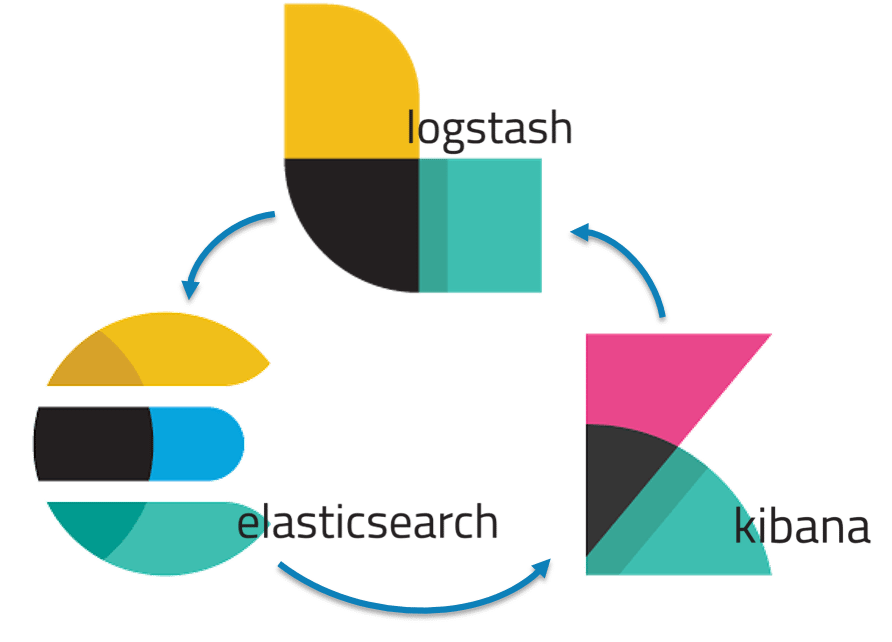
The ELK - is a combination of three open source tools which forms a log management tool/platform , that helps in deep searching , analyzing , visualizing the log generated from different machines .
ELK provides centralized logging that be useful when attempting to identify problems with servers or applications. It allows you to search all your logs in a single place. It also helps to find issues that occur in multiple servers by connecting their logs during a specific time frame.
- Search engine / search server
- NoSQL database i. e. can not use SQL for queries
- Provides horizontal scalability , reliability and multinant capability for real time search
- Uses indexes to search which make it faster
- Data pipeline
- Centralizes the data procesing
- Collect , parses , analyzes large variety of structured / unstaractured Data
- Provides plugins to connect to various types of input sources and platforms
- Provides real - time analysis , summarization , charting and debugging capabilities
- Provides instinctive and user friendly interface
- Allows sharing of snapshots of the logs
- Permits saving
To open the dashboards, launch the Kibana web interface by pointing your browser to port 5601. For example, http://localhost:5601. Replace localhost with the name of the Kibana host. If you’re using an Elastic Cloud instance, log in to your cloud account, then navigate to the Kibana endpoint in your deployment.
On the Discover page, make sure that the predefined filebeat-* index pattern is selected to see Filebeat data.
- inputs - is responsible for managing the harvesters and finding all sources to read from.If the input type is log, the input finds all files on the drive that match the defined glob paths and starts a harvester for each file. Each input runs in its own Go routine.
- harvesters - is responsible for reading the content of a single file. The harvester reads each file, line by line, and sends the content to the output.
- Splunk
- LogDNA
- Loggy
- Sumo Logic
- Uses Nginx as a reverse proxy for Kibana.
- Installs SSL certificate on the server VM.
- 5.6 and 2.4 ELK versions are maintained as branches and master branch will be 6.x currently
- Installs FileBeat agent on remote VMs to collect logs and push them to the main server.
- RHEL7 or CentOS7 server/client with no modifications and t2.medium size
- RHEL7/CentOS7 or Fedora for ELK clients using Filebeat
- ELK server with at least 4G of memory
- Current ELK version is 6.x
- nginx ports default to 443 for Kibana and SSL cert retrieval (configurable)
- Uses OpenJDK for Java
- It's fairly quick, takes around 3minutes on a test VM


