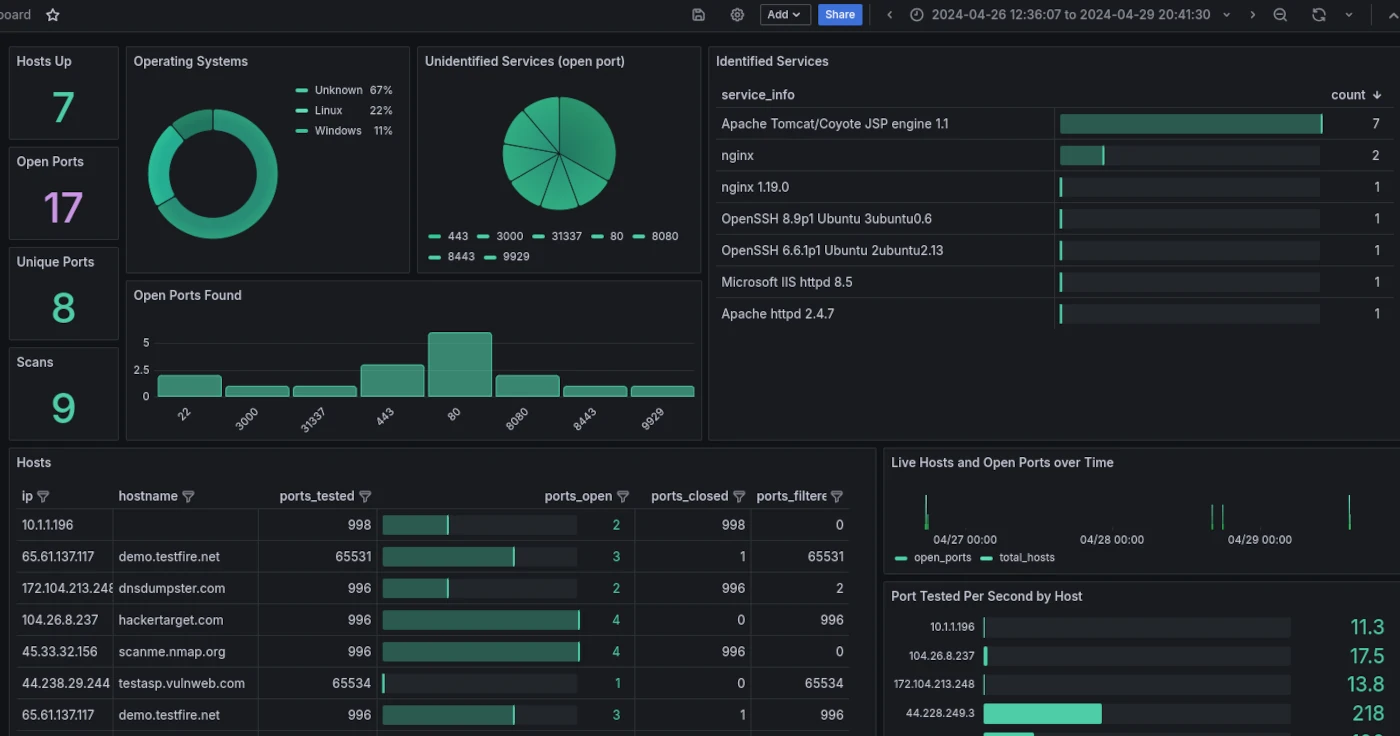
nmap-did-what is a Grafana docker container and a Python script to parse Nmap XML output to an SQLite database. The SQLite database is used as a datasource within Grafana to view the Nmap scan details in a dashboard.
Full Tutorial is available here - Nmap Dashboard using Grafana
The project consists of two main components:
- A Python script that parses Nmap XML output and stores the data in an SQLite database.
- A Grafana Docker container with a pre-configured dashboard for visualizing the Nmap scan data.
- nmap-to-sqlite.py: A Python script that parses Nmap XML output and stores the data in an SQLite database.
- Dockerfile: Creates a Docker container based on the official Grafana image, including the necessary configurations for the SQLite data source and dashboard.
- docker-compose.yml: A Docker Compose file that sets up the Grafana container, configuring it to use the SQLite database and including volumes for persistent storage and configuration.
- dashboard.yml: A configuration file that specifies the dashboard provider settings for Grafana.
- datasource.yml: Configures Grafana to use the SQLite database containing the Nmap scan data as the data source.
- /data/nmap_results.db: location in container for the SQLite DB.
To get started with nmap-did-what, ensure you have Docker and Docker Compose installed on your system.
Follow these steps to deploy the environment:
- Clone the repository
git clone https://github.com/hackertarget/nmap-did-what.git
- Parse Nmap XML output
Run the nmap-to-sqlite.py script to parse your Nmap XML output and store the data in an SQLite database:
cd nmap-did-what/data/
python nmap-to-sqlite.py nmap_output.xml
- Start the Grafana Container
Use Docker Compose to start the Grafana container:
cd nmap-did-what
docker-compose up -d
- Access Grafana
Once the container is up and running, access the Grafana dashboard through your web browser:
http://localhost:3000
Use the default Grafana credentials (admin/admin) unless changed in the configuration. The Nmap dashboard should be loaded with the data from your Nmap scans.
Multiple scans can be reviewed within the DB and the Nmap Dashboard time filters can be used to the view the scan information based on the time stamps from the scans.
- Modify the
nmap-to-sqlite.pyscript to extract additional information from the Nmap XML output or to change the structure of the SQLite database. - Custom Dashboard are easy to implement, simply adjust the Grafana dashboard to your requirements. Export the JSON of the Dashboard and replace the default Dashboard or create additional dashboard. The ability to spin up a Grafana Docker container with a prebuilt Dashboard is a nice feature.
- Automation is possible, as you can simply run nmap with a cron job, parse the XML with nmap-to-sqlite.py and the updated DB will have the newly acquired scan information.
Thanks to the Nmap and Grafana projects for providing powerful open-source tools for network scanning and data visualization.