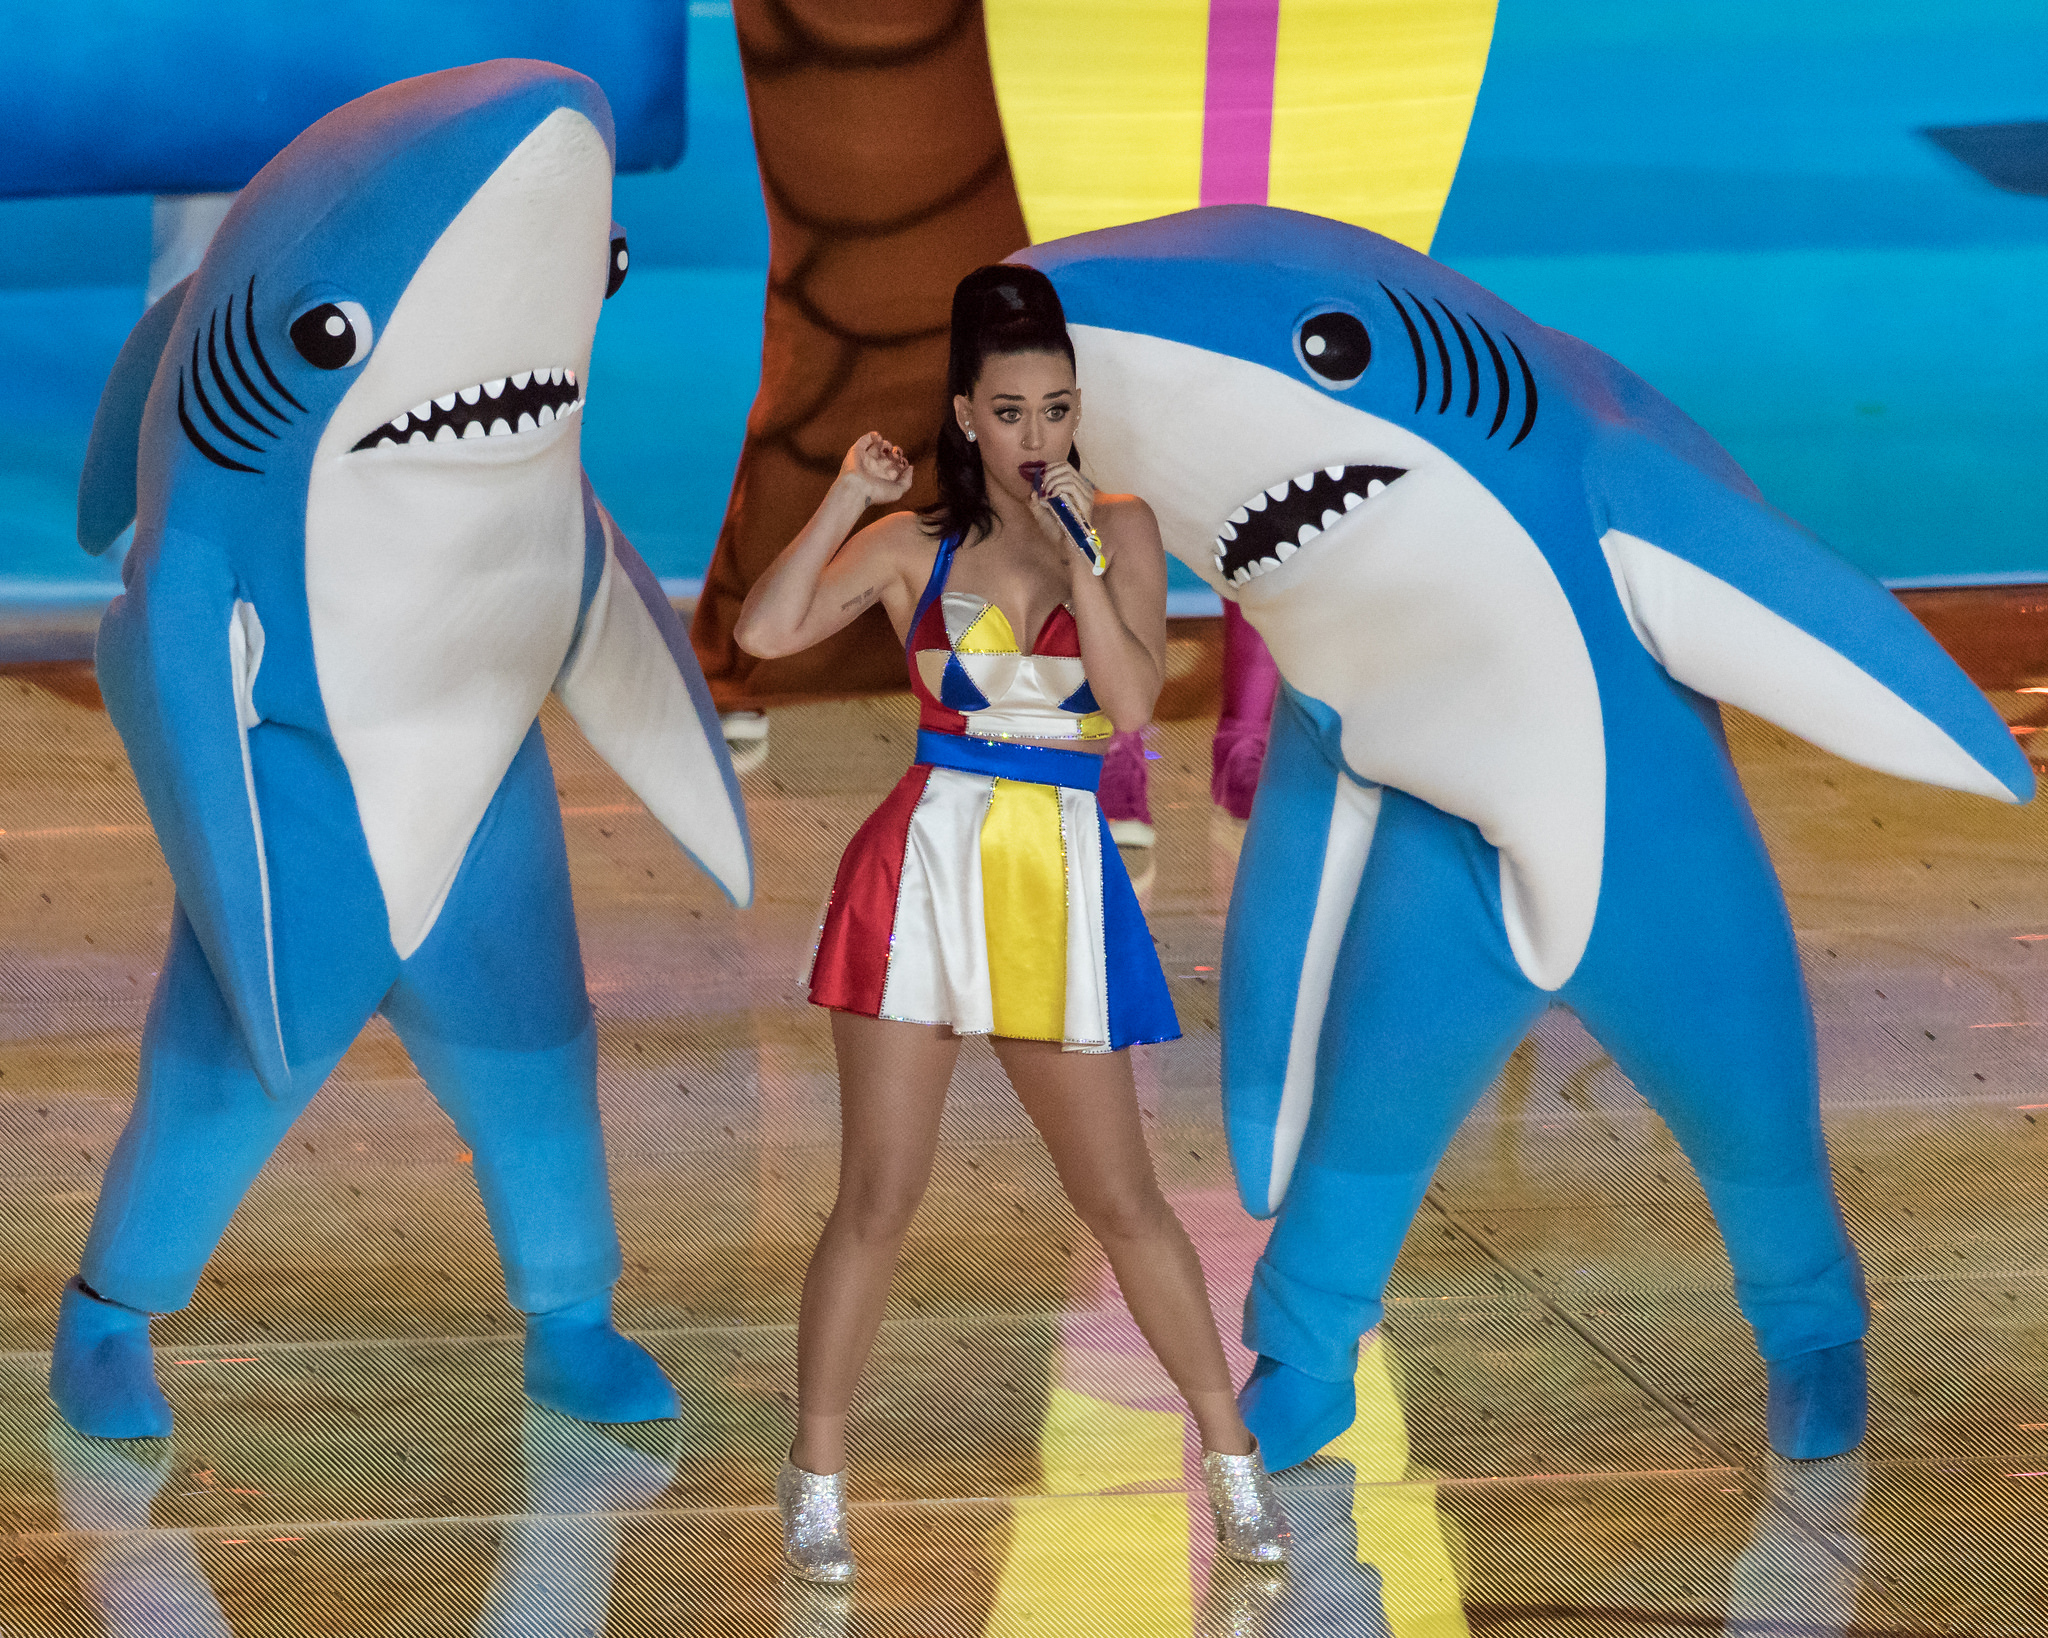
Whether or not you like football, the Super Bowl is a spectacle. There's a little something for everyone at your Super Bowl party. Drama in the form of blowouts, comebacks, and controversy for the sports fan. There are the ridiculously expensive ads, some hilarious, others gut-wrenching, thought-provoking, and weird. The half-time shows with the biggest musicians in the world, sometimes riding giant mechanical tigers or leaping from the roof of the stadium. It's a show, baby. And in this notebook, we're going to find out how some of the elements of this show interact with each other. After exploring and cleaning our data a little, we're going to answer questions like:
- What are the most extreme game outcomes?
- How does the game affect television viewership?
- How have viewership, TV ratings, and ad cost evolved over time?
- Who are the most prolific musicians in terms of halftime show performances?

The dataset we'll use was scraped and polished from Wikipedia. It is made up of three CSV files, one with game data, one with TV data, and one with halftime musician data for all 52 Super Bowls through 2018. Let's take a look, using display() instead of print() since its output is much prettier in Jupyter Notebooks.