3d plotting for Python in the Jupyter notebook based on IPython widgets using WebGL.
Ipyvolume currenty can
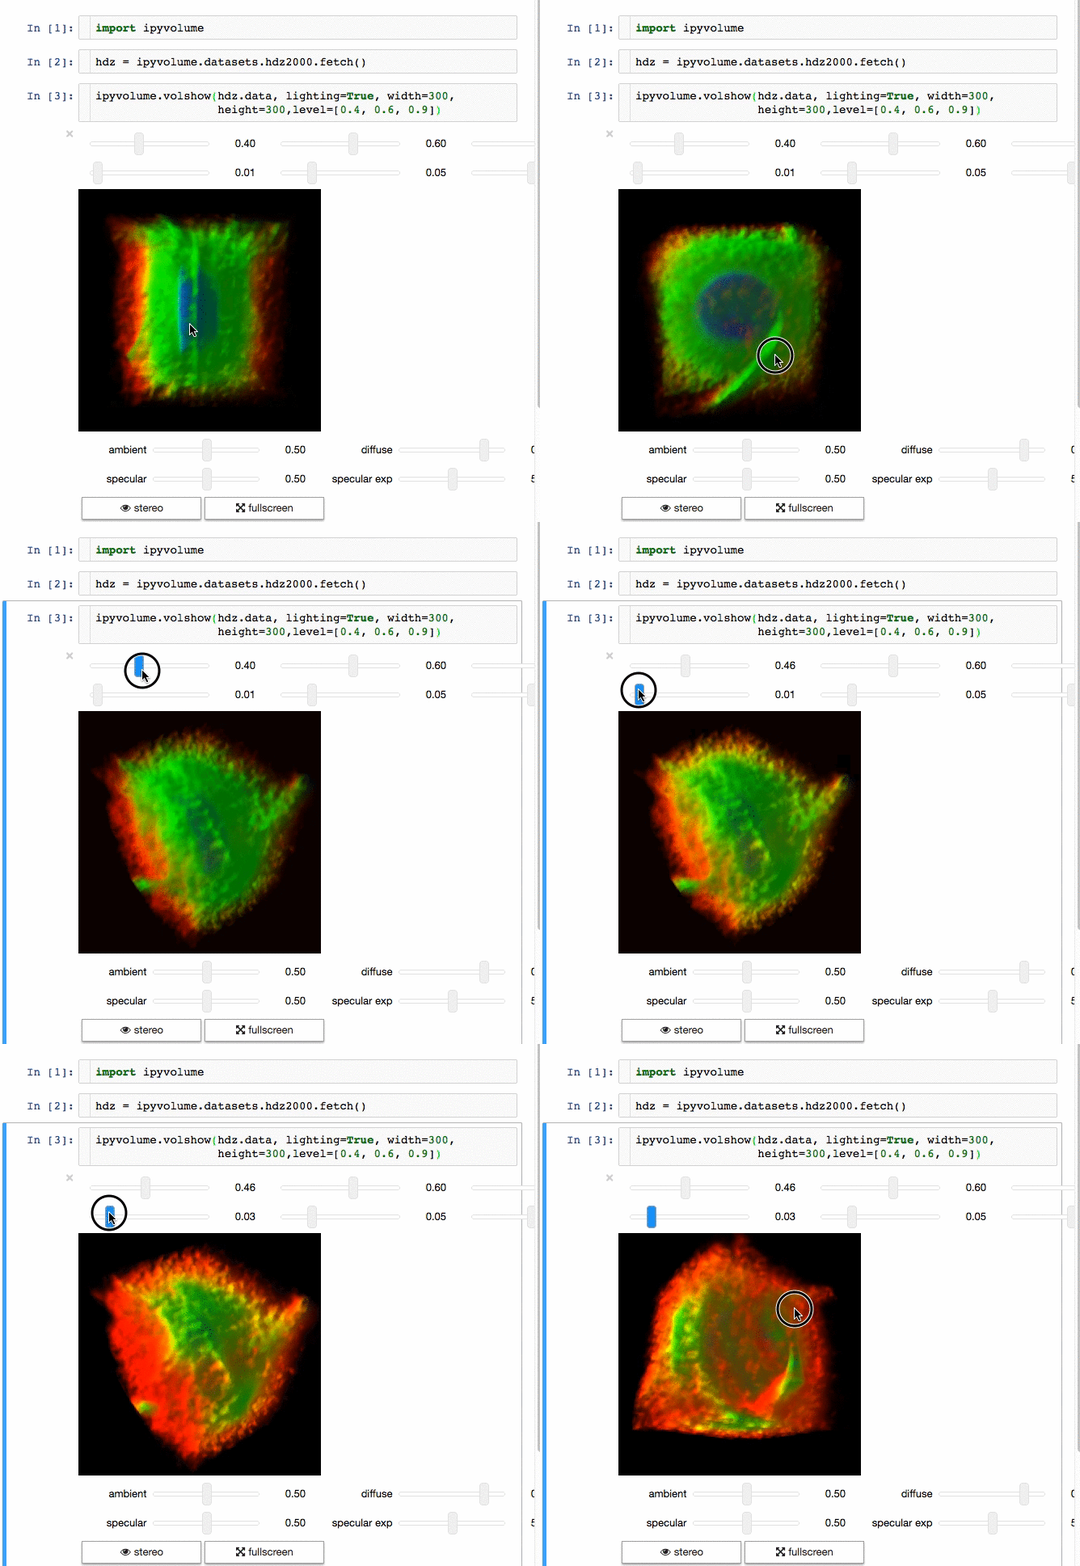
- Do volume rendering.
- Create scatter plots (up to ~1 million glyphs).
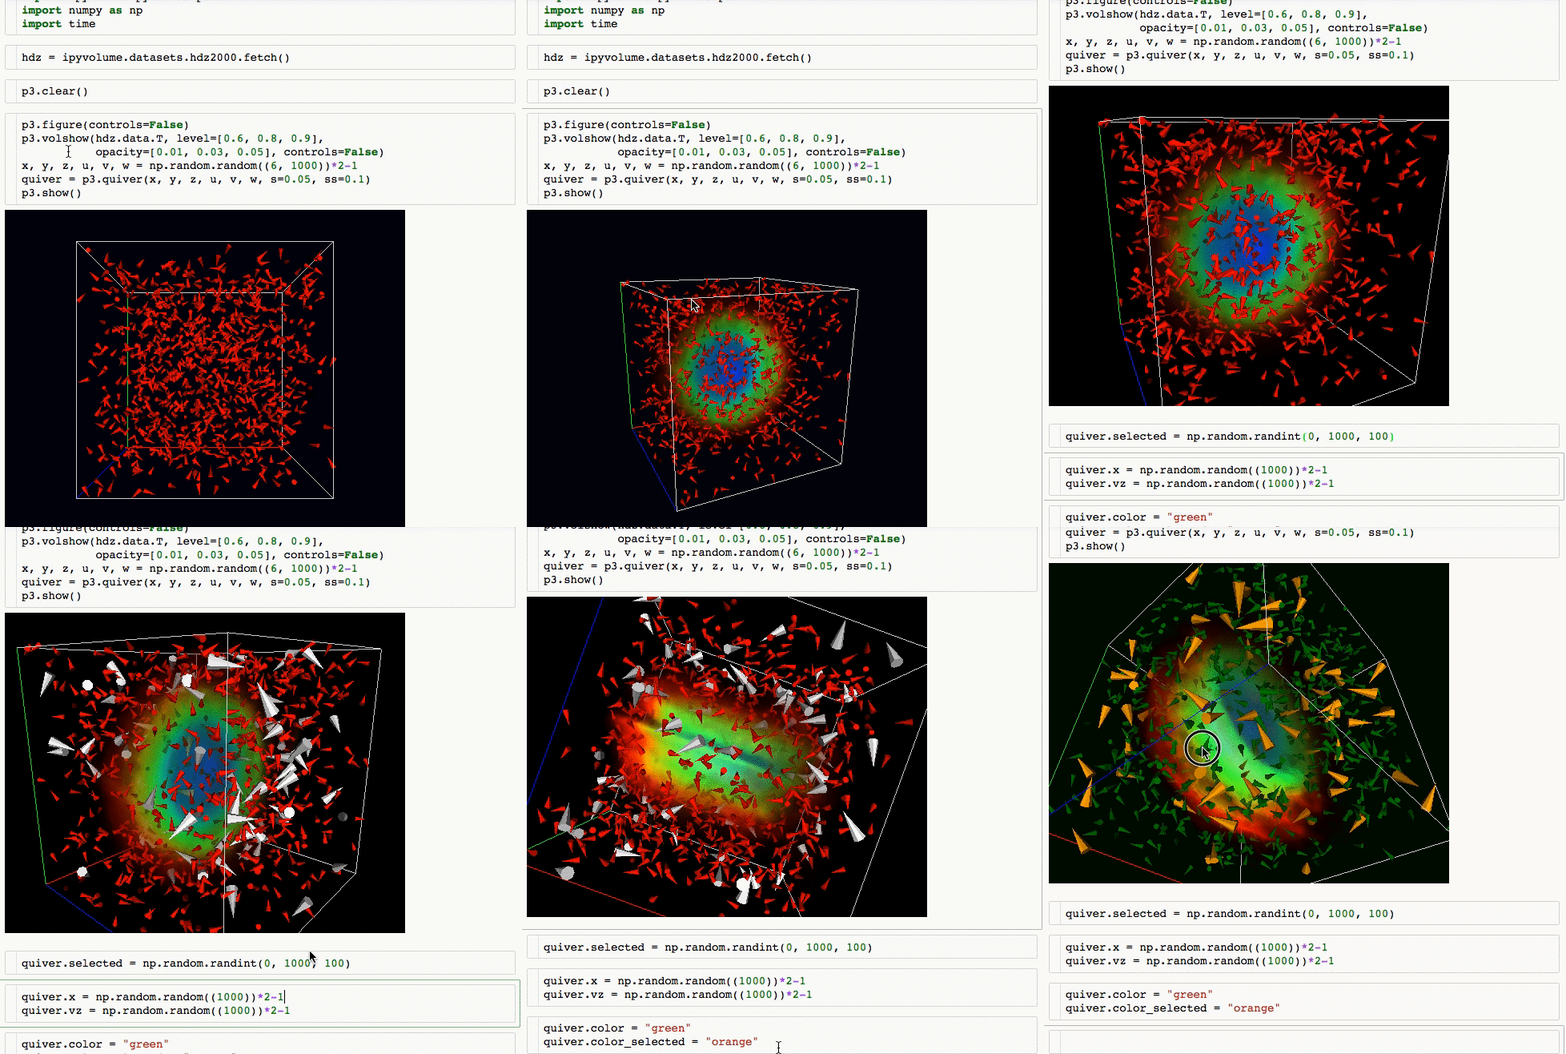
- Create quiver plots (like scatter, but with an arrow pointing in a particular direction).
- Render in the Jupyter notebook, or create a standalone html page (or snippet to embed in your page).
- Render in stereo, for virtual reality with Google Cardboard.
- Animate in d3 style, for instance if the x coordinates or color of a scatter plots changes.
- Animations / sequences, all scatter/quiver plot properties can be a list of arrays, which can represent time snapshots.
- Stylable (although still basic)
- Integrates with
- ipywidgets for adding gui controls (sliders, button etc), see an example at the documentation homepage
- bokeh by linking the selection
- bqplot by linking the selection
Ipyvolume will probably, but not yet:
- Render labels in latex.
- Do isosurface rendering.
- Do selections using mouse or touch.
- Show a custom popup on hovering over a glyph.
Documentation is generated at readthedocs:
(see more at the documentation)
For all cases make sure ipywidgets is enabled after installation, if not already, e.g.:
$ jupyter nbextension enable --py --sys-prefix ipywidgets
To install use pip:
$ pip install ipyvolume
$ jupyter nbextension enable --py --sys-prefix ipyvolume
To install use pip (as non-admin):
$ pip install ipyvolume --user
$ jupyter nbextension enable --py --user ipyvolume
Or with anaconda/conda:
$ pip install ipywidgets
$ # or pip install ipywidgets~=7.0.0b1 # for github master
$ conda install -c conda-forge ipyvolume
For a development installation (requires npm),
$ git clone https://github.com/maartenbreddels/ipyvolume.git
$ cd ipyvolume
$ pip install -e .
$ jupyter nbextension install --py --symlink --sys-prefix ipyvolume
$ jupyter nbextension enable --py --sys-prefix ipyvolume
After changing the javascript, run npm install from the js directory, or webpack --watch and work from the examples/dev.ipynb notebook,


