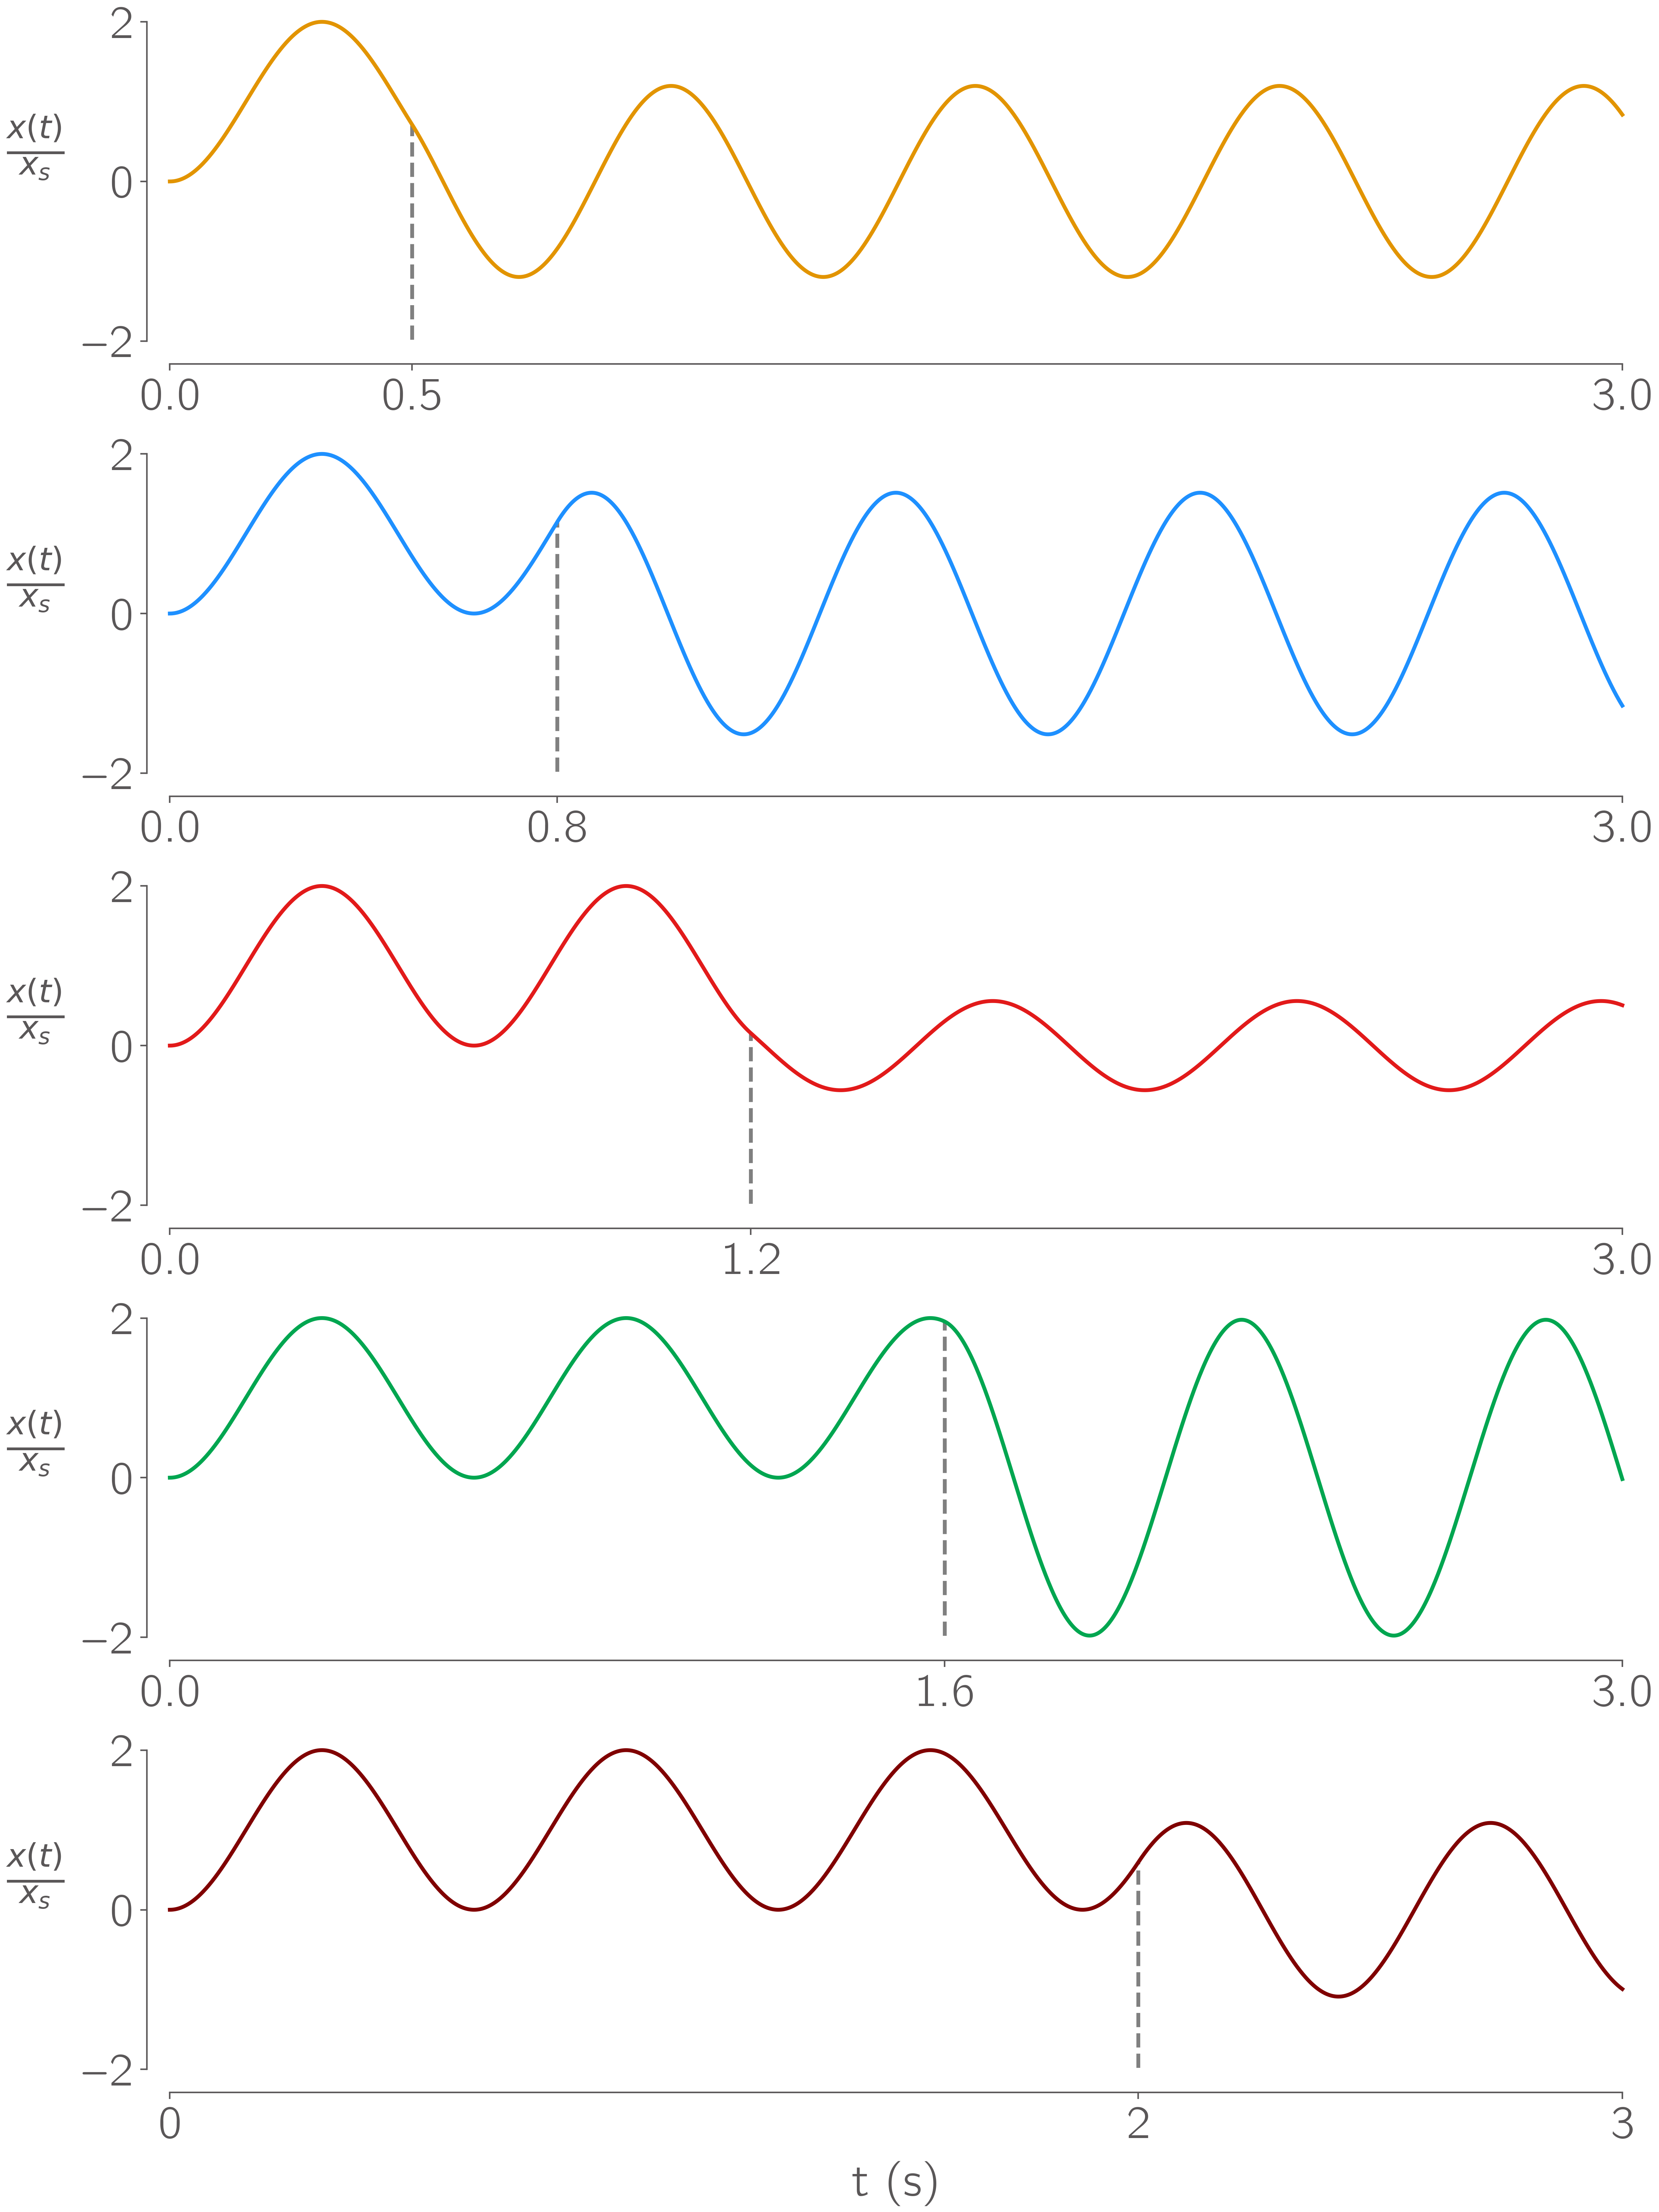
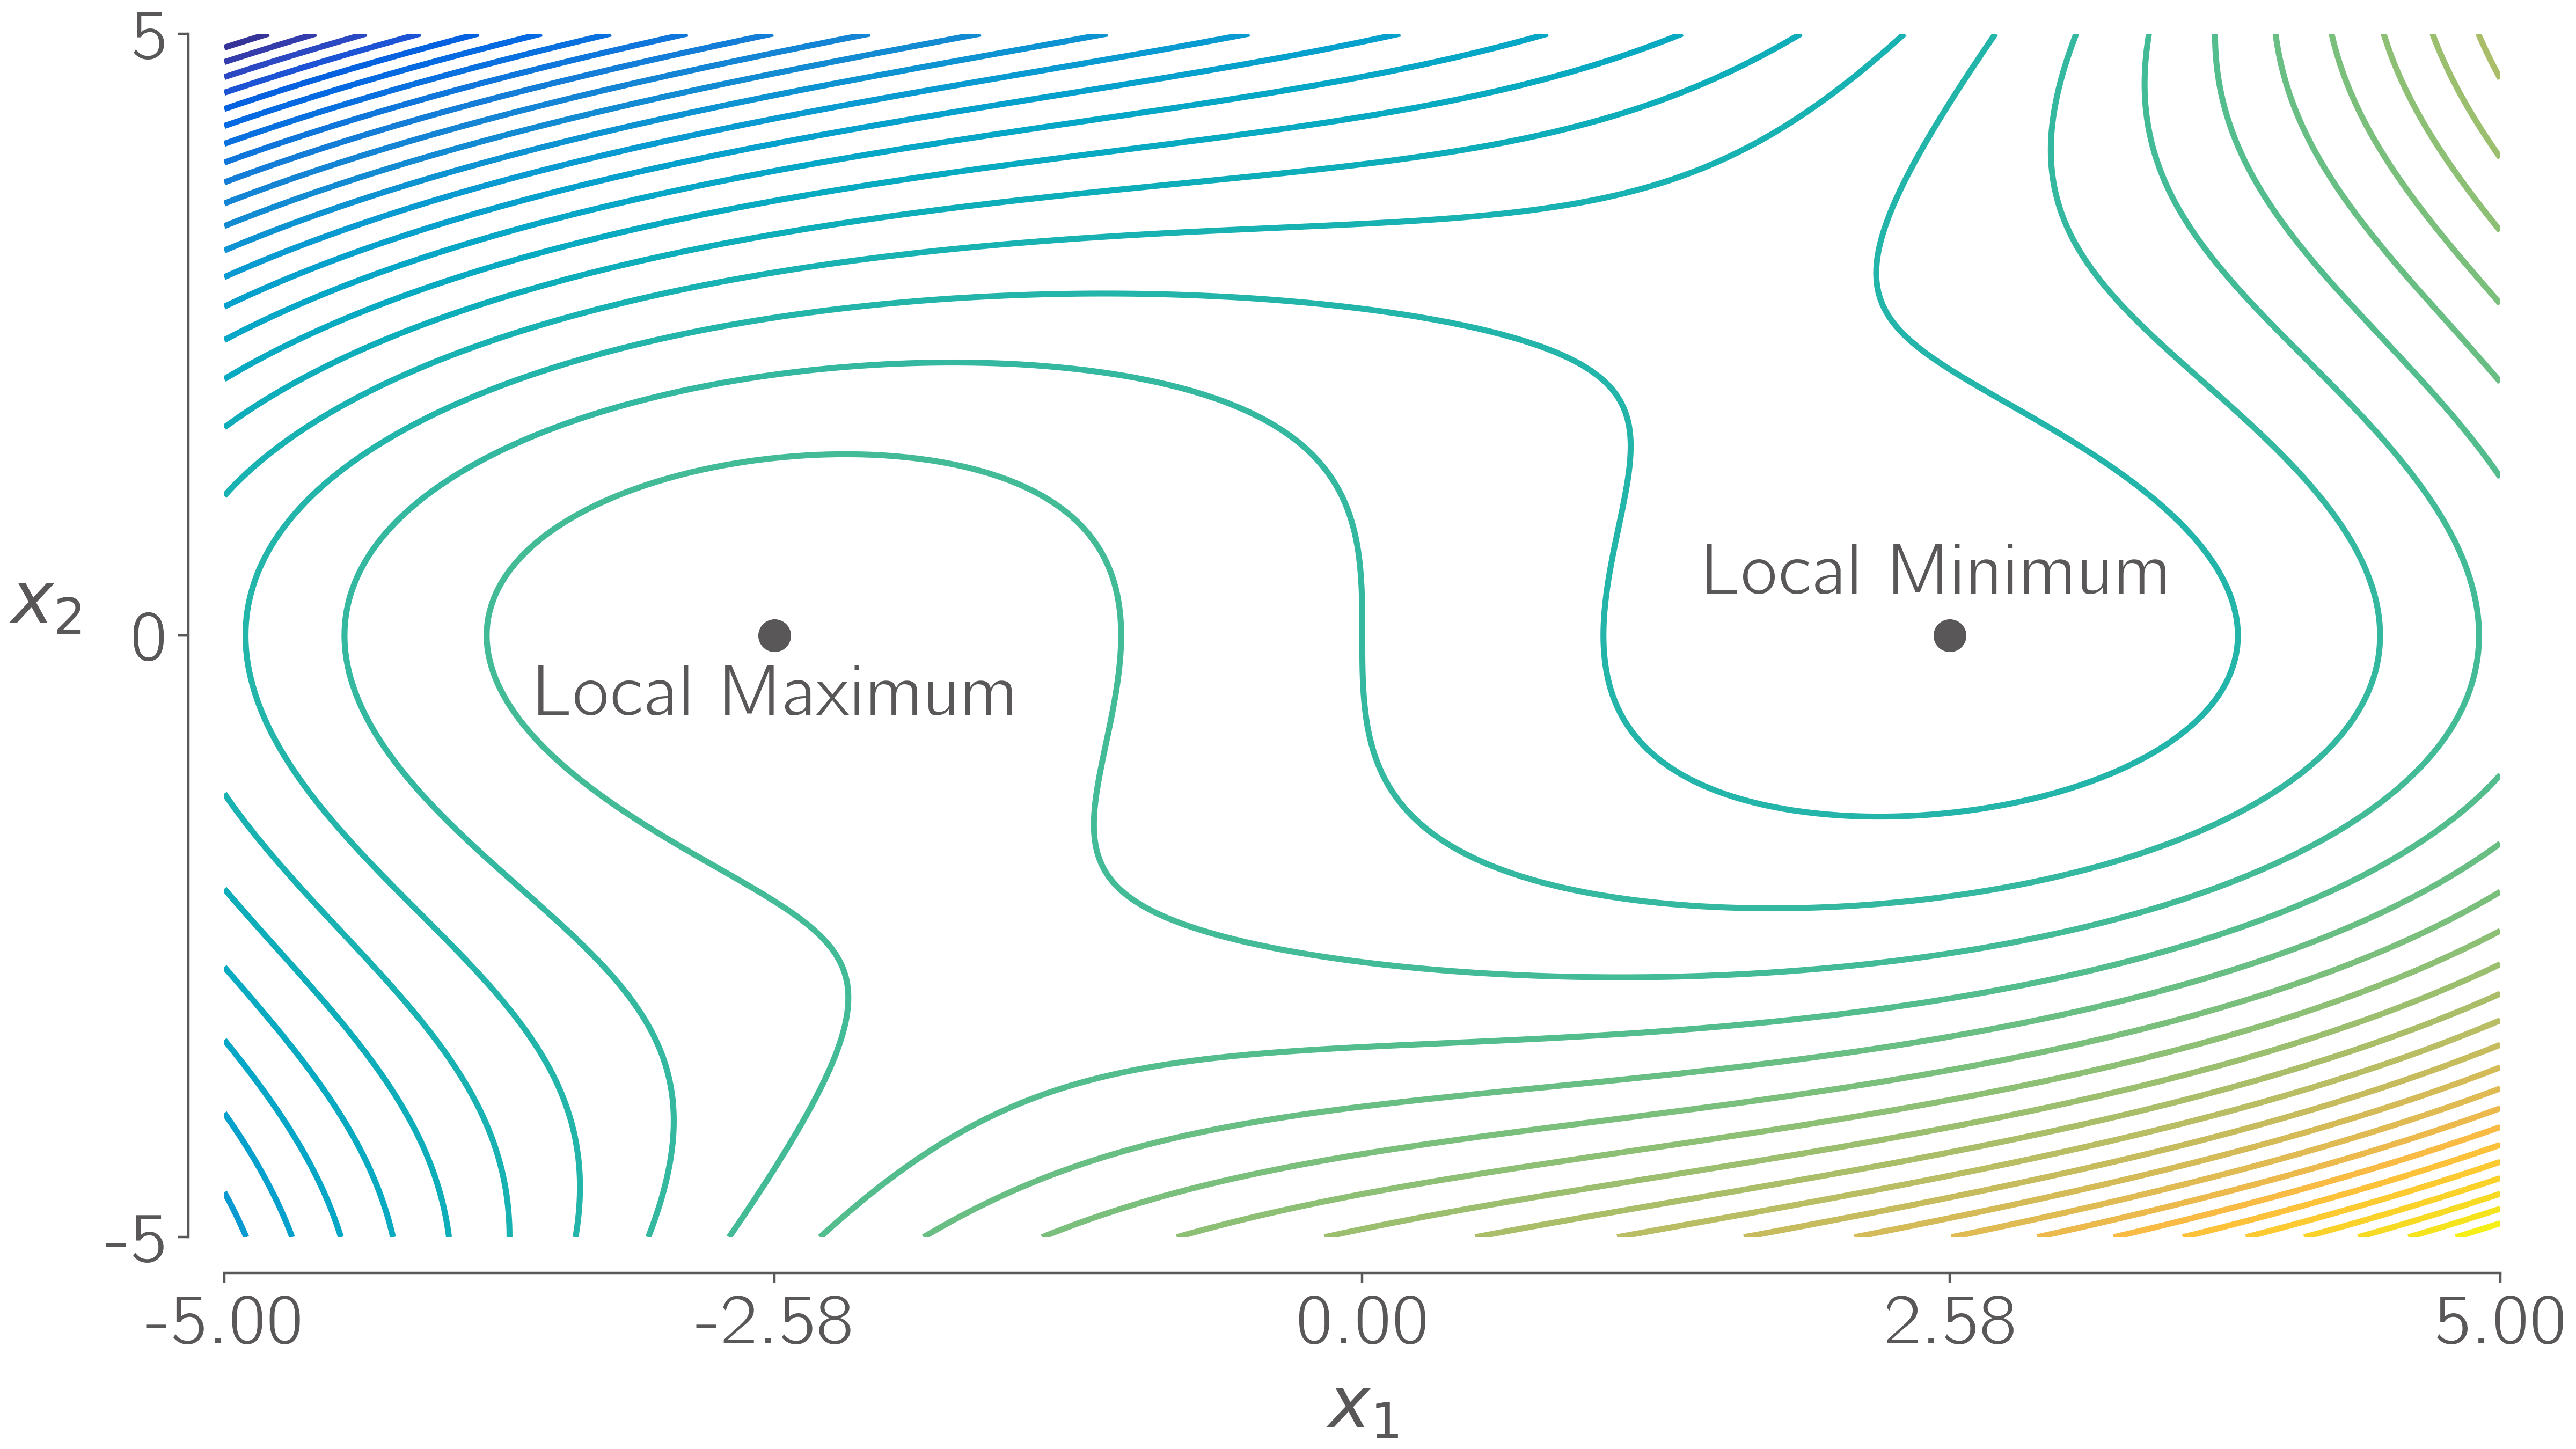
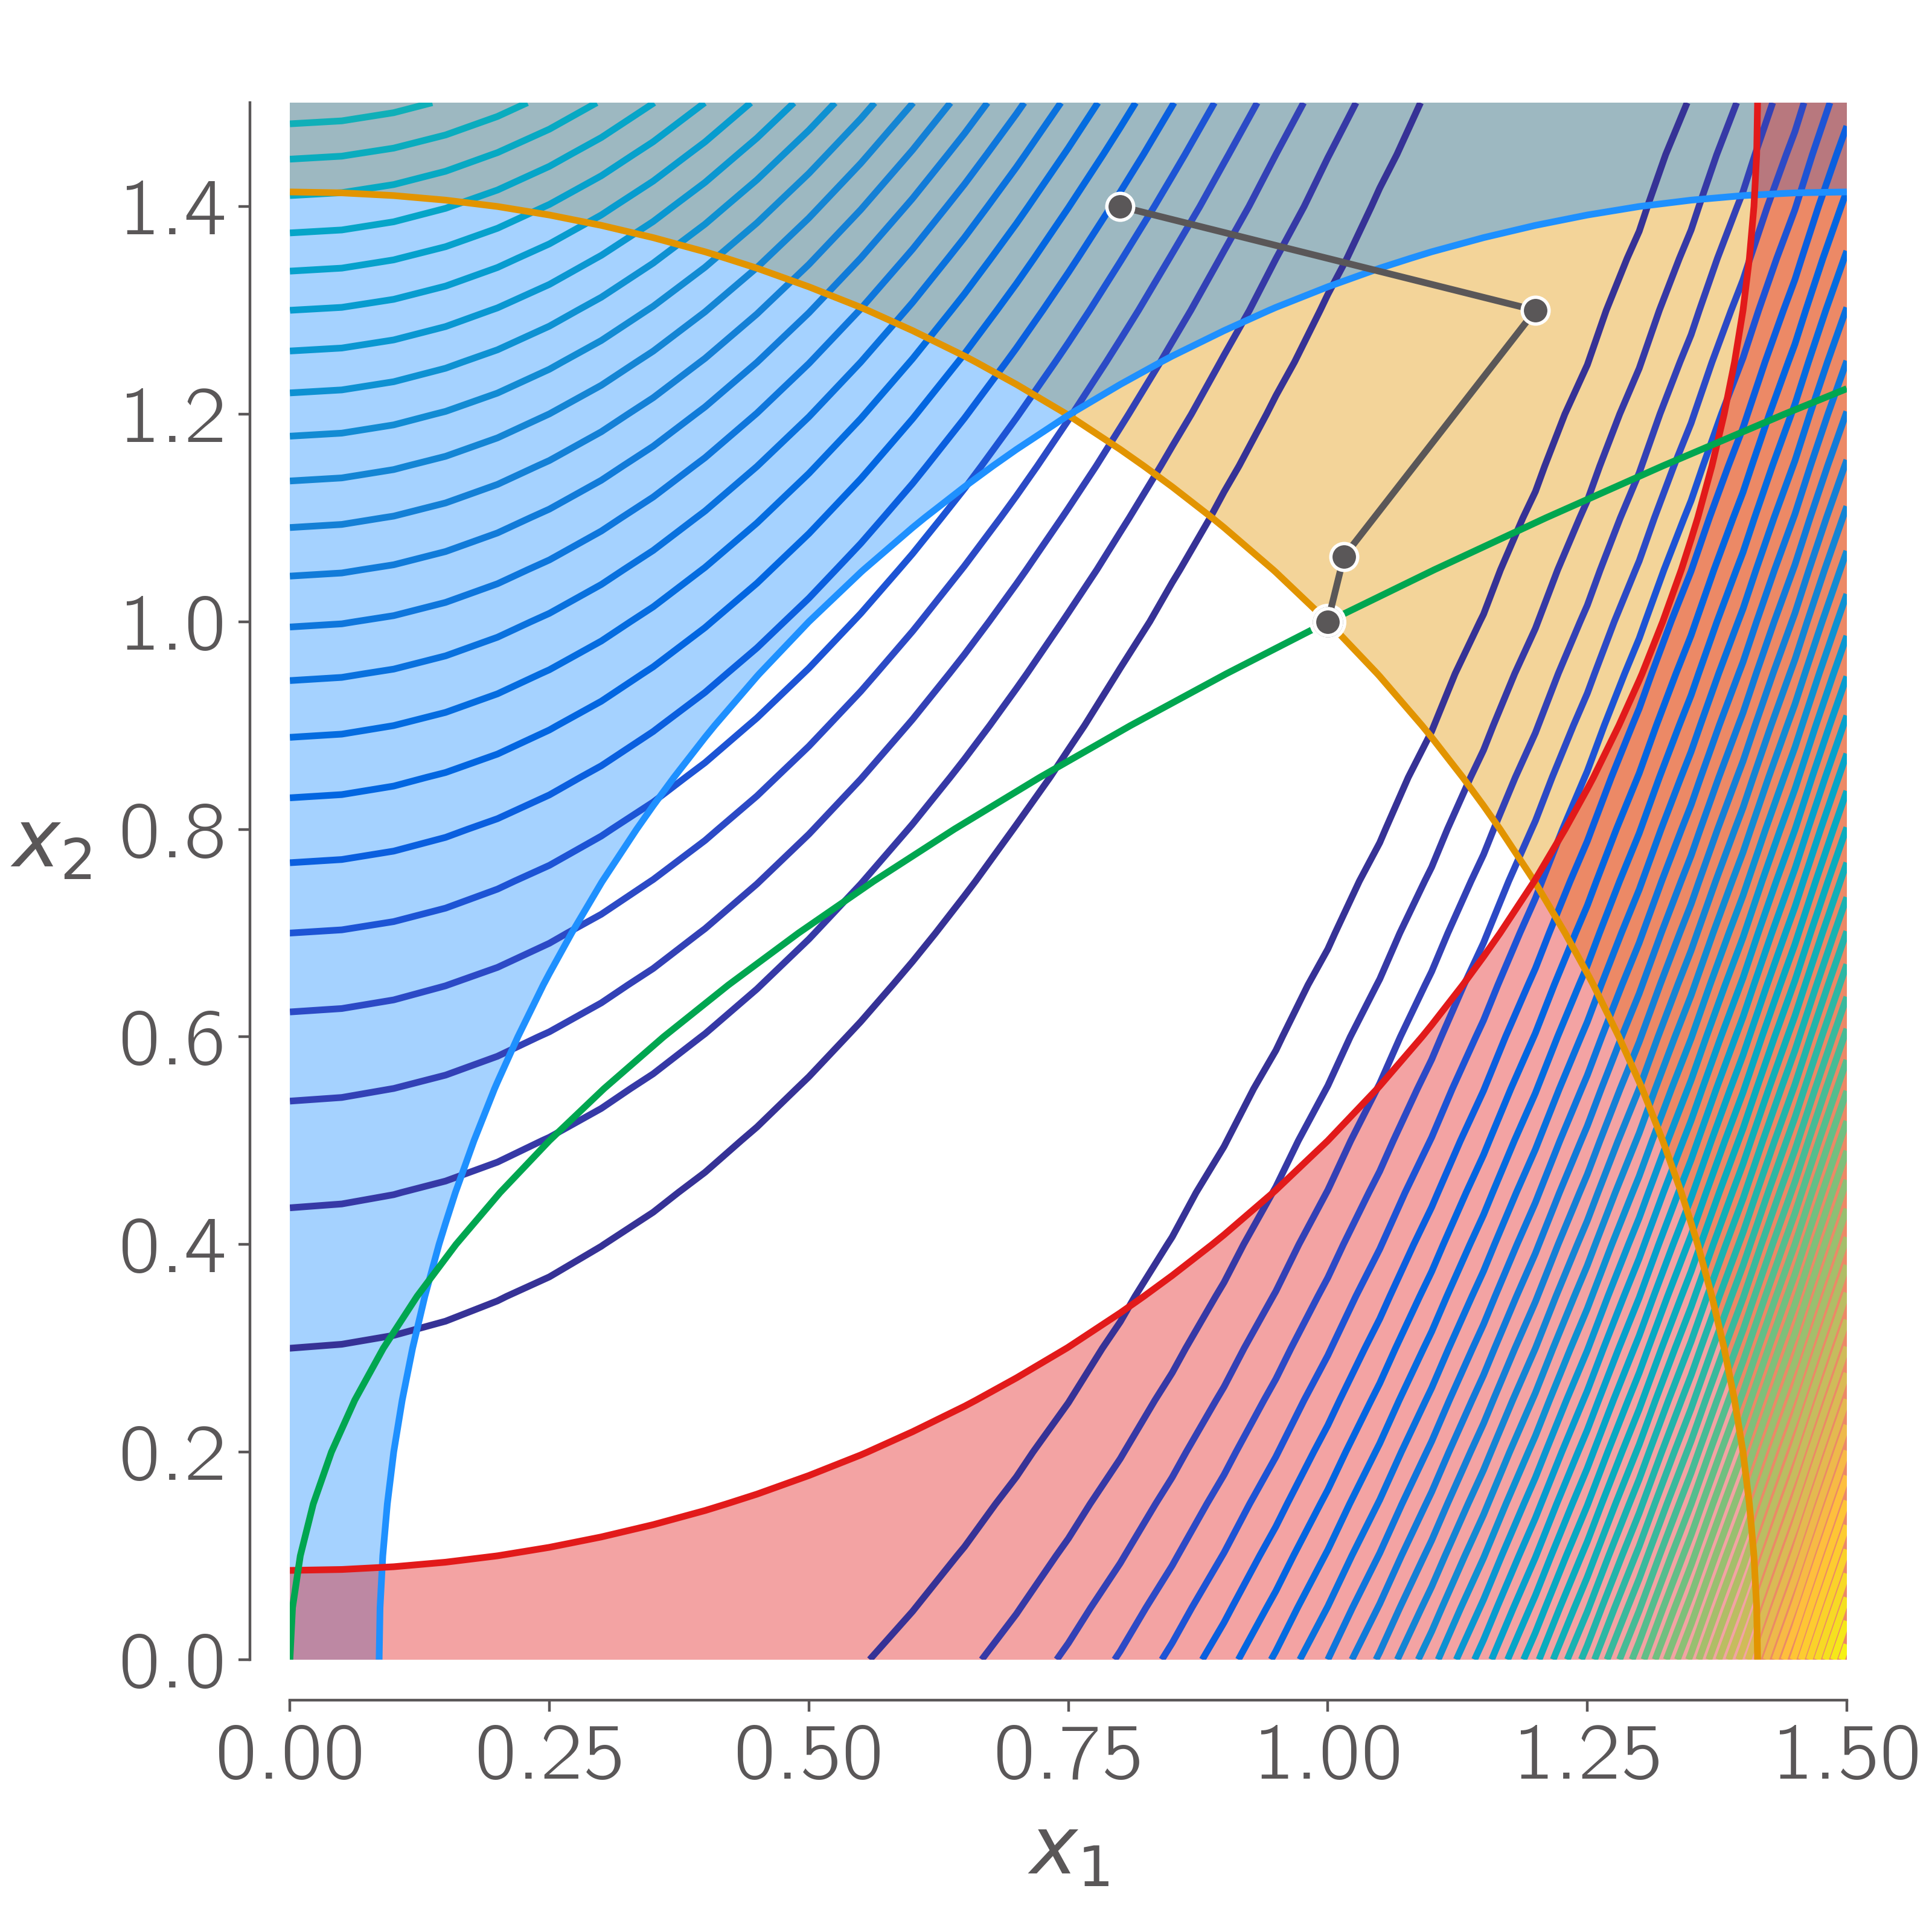
- Clone this repository, then enter the folder in the command line terminal.
- Enter
pip install -e .within theniceplotsfolder.
Niceplots will try and use the computer modern bright font for the best looking plots so be sure to install it as a system font if you want to recreate the style of the plots above. Otherwise, niceplots will still work but revert back to the matplotlib default sans-serif font, DejaVu Sans.
- Use
import niceplotsat the top of a file where you would like to use any function defined in this package. - Use
niceplots.setRCParams()to set some matplotlib defaults for nice looking plots. Setdark_mode=Trueandset_background_color=Trueto make plots with a dark background. - Use
niceplots.all()after all the plot commands to apply the niceplot standards on the figure. - To use the Matlab colormap "parula", execute
from niceplots import parulathen useparula.parula_mapas your colormap within your plotting script. See the contour plot example code for an example of this.
- Make any changes you see fit. Please fork your own version and submit a pull request.
- Alasdair Gray, alachris@umich.edu
- Eirikur Jonsson eirikurj@umich.edu


