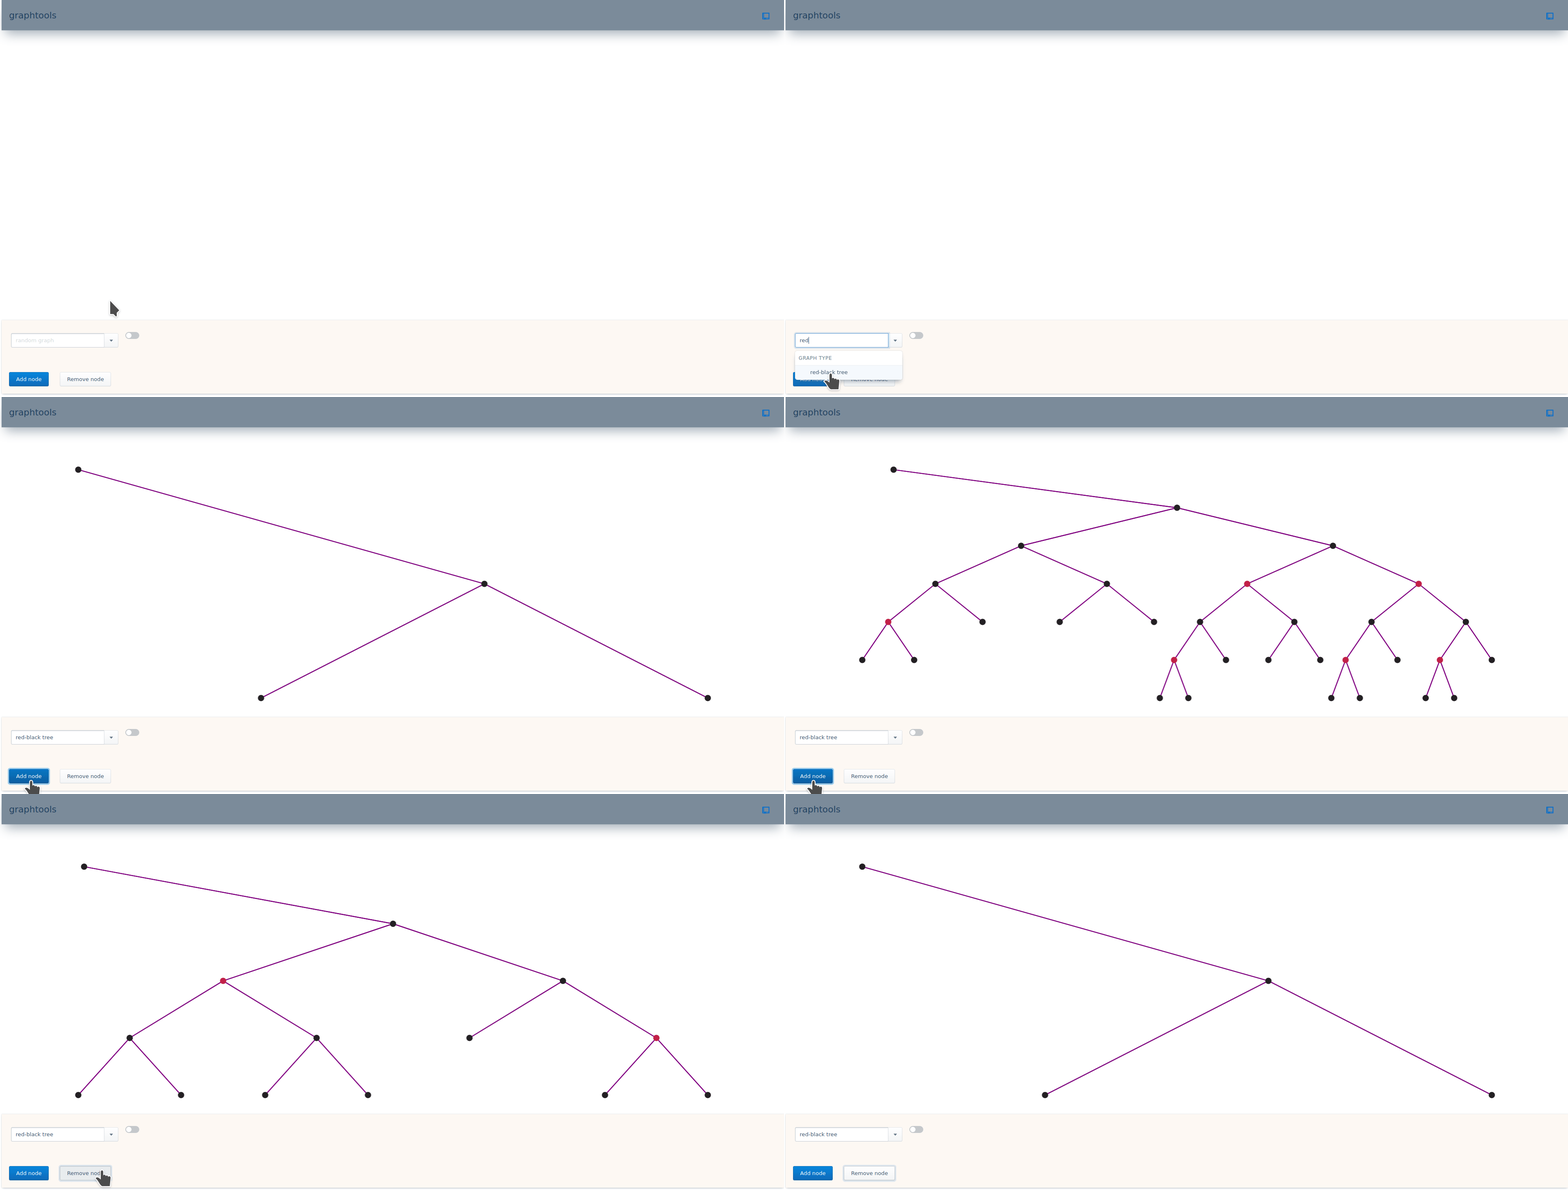
Go library for experimenting with graph algorithms
Can serve graph/algorithm results over websocket
A bidirectional, synchronous, online, JSON API is defined for communicating requests between the underlying graph and the user interface.
The server will only hold one structure at a time per client connection. In the case of switching structures, the client must explicitly call the creation method for that structure. Upon structure creation, the server will maintain the new structure and allow the old one to be garbage collected.
Client-to-server requests take the following form:
{
    structure: "data-structure-name",
    action: "action-to-perform",
    params: "params-to-pass-to-action",
}
The client should reference the datastructure/algorithm-specific API to know what actions to call and associated parameters to provide. The parameters are casted to the expected type on the server-side. Thus, an action call will fail if the parameters are not able to be successfully converted. Be aware that this may cause unexpected consequences if, for example a float is converted to an integer.
If you intend to send a CSV to the generic graph display manager, then the format is as such:
numNodes numEdges maxEdgeWeight
n1_id n1_x n1_y n1_z
...
nn_id nn_x nn_y nn_z
e1_n1_id e1_n2_id
...
em_n1_id em_n2_id
Server-to-client responses take the following form:
{
    type: graph-structure-type,
    graph-manager-params...,
    graph: {
        numNodes: num-graph-nodes,
        numEdges: num-graph-edges,
        maxEdgeWeight: max-edge-weight,
        nodes: [
        {
            id: node-id,
            node-extra-data...,
            coords: node-coords,
            edges: [
            {
                weight: edge-weight,
                noderepr: [
                {
                    id: node-0-id,
                    tag: node-0-tag,
                },
                {
                    id: node-1-id,
                    tag: node-1-tag,
                },
                ]
            },
            ...
            ]
        },
        ...
        ]
    }
As you can see, the display should know about the datastructure/algorithm-specific meaning of graph-manager-params in order to provide a more rich graph display. For example, in order to show the node color of a node in a red-black tree. Otherwise, the graph can still be shown with default visual representation provided that the UI understands the meaning of the default parameters.
github.com/han-so1omon/graphtools-ui
- Order nodes and edges upon insertion in order to implement binary searching
- Algorithm demos
- Bug in tracking node heights of RBTree

