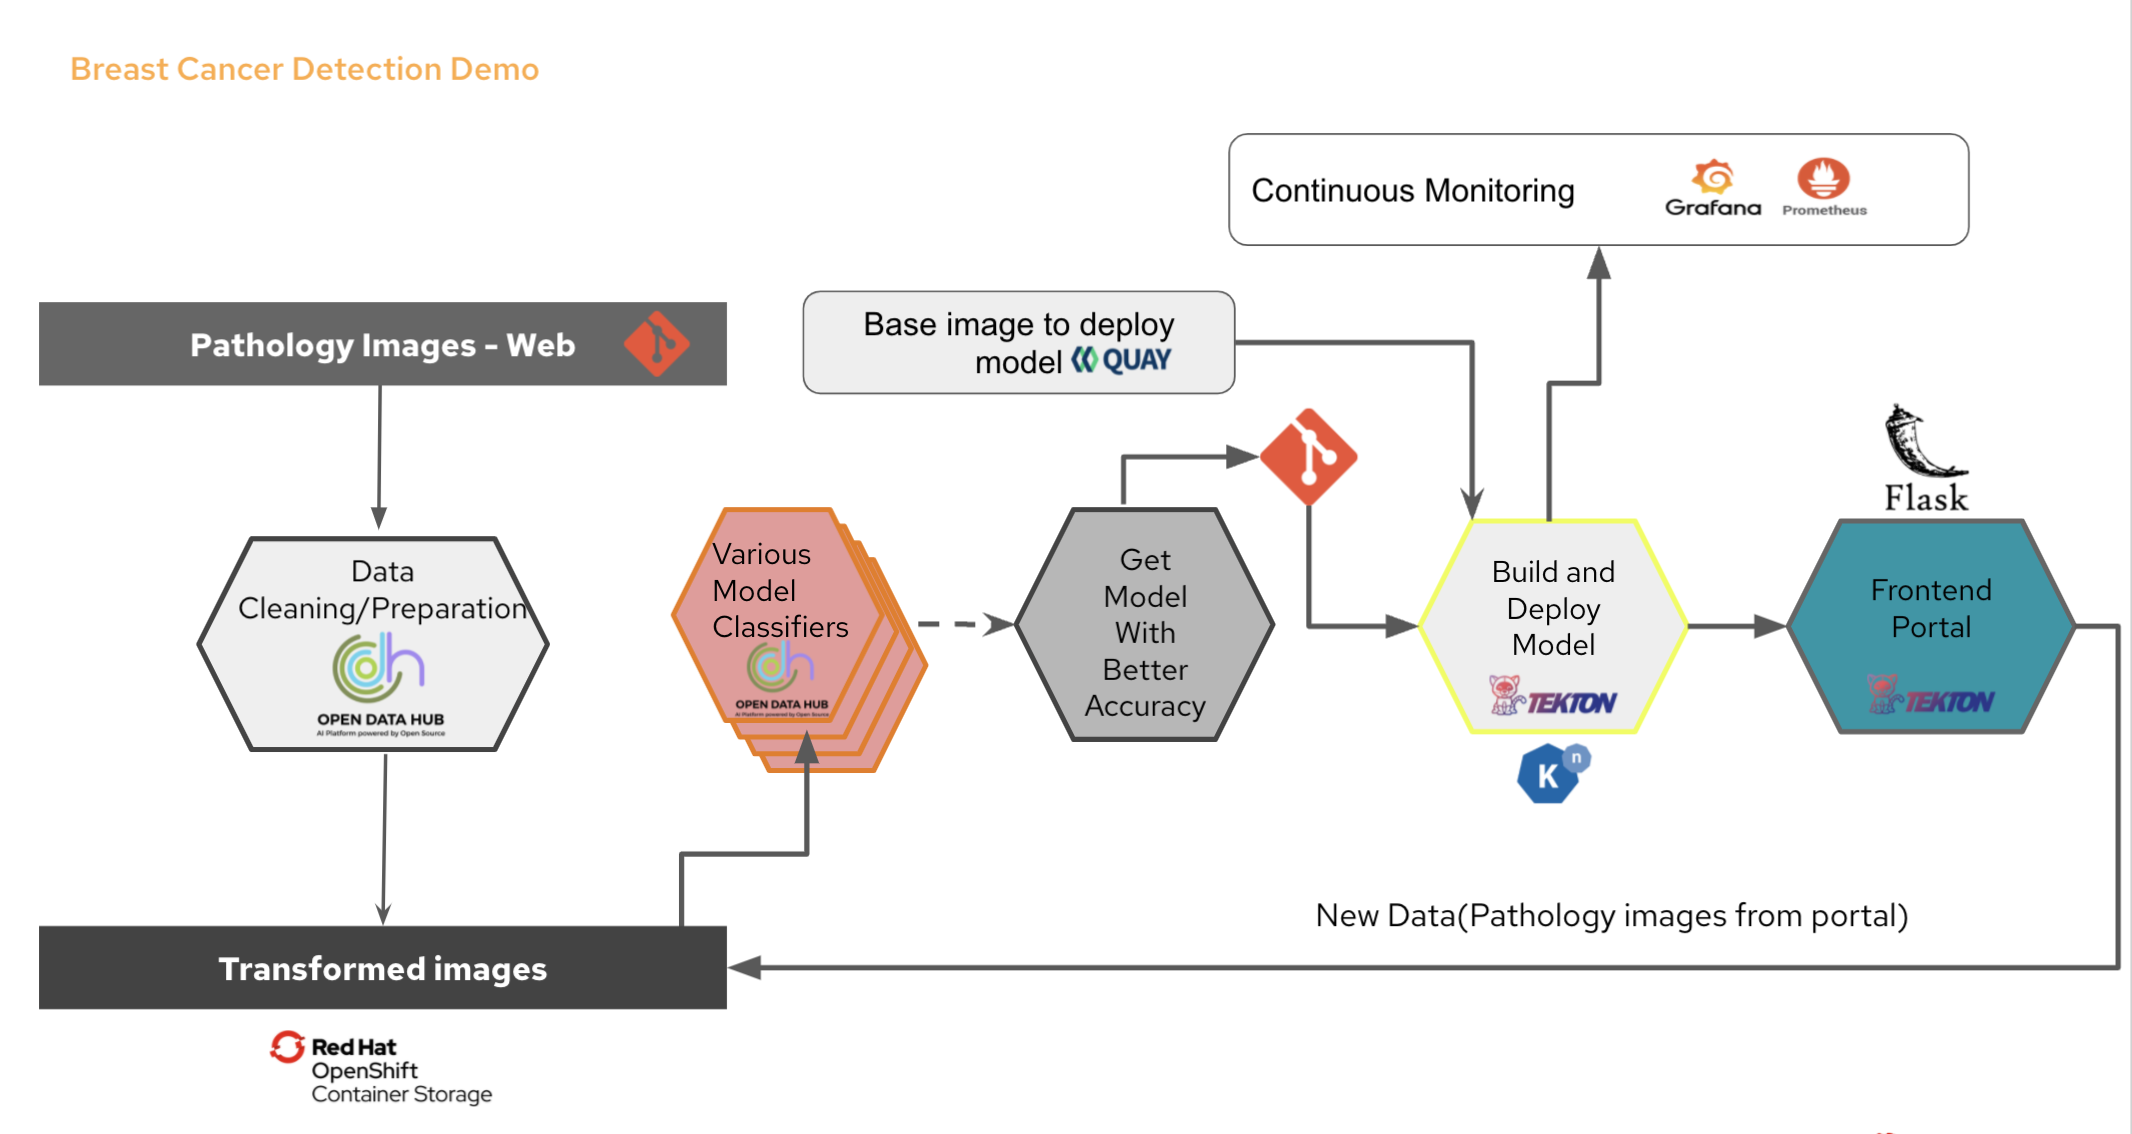
This is the Flask based frontend app to use breast cancer detection model to classify whether the uploaded pathology images are malign or benign.
Parts of this demo:
Create a project "ai-ml-demo" in Openshift. We will be using this throughout the demo.
oc new-project ai-ml-demoPre-requisites:
- Install Red Hat Openshift Serverless Operator
- Create a serviceaccount named "pipeline" to run the pipelines
- In order to showcase full demo and you do not have external jupyter hub access,please install OpenDataHub operator from OperatorHub and create instance with jupyterhub components. Sample steps below.
- Click create instance-> go to yaml view and paste the below code and click create.
apiVersion: kfdef.apps.kubeflow.org/v1
kind: KfDef
metadata:
  name: opendatahub
  namespace: ai-ml-demo
spec:
  applications:
    - kustomizeConfig:
        repoRef:
          name: manifests
          path: odh-common
      name: odh-common
    - kustomizeConfig:
        parameters:
          - name: s3_endpoint_url
            value: s3.odh.com
        repoRef:
          name: manifests
          path: jupyterhub/jupyterhub
      name: jupyterhub
    - kustomizeConfig:
        overlays:
          - additional
        repoRef:
          name: manifests
          path: jupyterhub/notebook-images
      name: notebook-images
    - kustomizeConfig:
        repoRef:
          name: manifests
          path: odh-dashboard
      name: odh-dashboard
  repos:
    - name: kf-manifests
      uri: 'https://github.com/kubeflow/manifests/tarball/v1.3-branch'
    - name: manifests
uri: 'https://github.com/opendatahub-io/odh-manifests/tarball/v1.1.0'- Click ODH Dashboard-this is the opensource version of RHODS. As we added only jupyter hub components, we will have that enabled here.
- On Jupyeter hub card, Click on Launch. You will be directed to the hub, which is Datascience IDE.
- Select Tensorflow notebook and keep everything else as it is and Click start server.
- Your jupyter hub environment will be ready.
- On the top right, click New->Terminal. You will be directed to command line prompt.
- Here, lets clone our notebooks.
git clone https://github.com/hanvitha/breastcancer_detection.git- Now go back to the hub, you have the notebooks repo locally now to work on.
- To see how the model is developed, go to *image_processing_model.ipynb. This will take long time to run incase you decide to run this.
- To test that our model is deployed right, you can run *test_services.ipynb. This can be done successfully once our pipeline run is done.
oc apply -f https://raw.githubusercontent.com/hanvitha/breastcancer_pipelines/master/tasks/s2i-model.yaml
oc apply -f https://raw.githubusercontent.com/hanvitha/breastcancer_pipelines/master/resources/build-image.yaml
oc apply -f https://raw.githubusercontent.com/hanvitha/breastcancer_pipelines/master/resources/build-source.yaml
oc apply -f https://raw.githubusercontent.com/hanvitha/breastcancer_pipelines/master/pipeline/deploy-pipelines.yaml
If you have tekton installed, run
tkn pipeline start bcd --serviceaccount='pipeline' --showlogClick enter to choose default options till the pipeline runs
You can also go to pipeline in Openshift console and Start Run with all defaults
- In Openshift Console, Go to Developer perspective
- Make sure you are in ai-ml-demo project
- Click on +Add
- Choose from Git
- Copy paste the current repo
- Keep everything default and click Create
oc new-app -n ai-ml-demo https://github.com/hanvitha/breastcancer_portal.git
oc expose service/breastcancerportaloc new-app prom/prometheus
oc expose service/prometheus
curl https://raw.githubusercontent.com/hanvitha/breastcancer_detection/master/mlworkflows/prometheus.yaml -o prometheus.yaml
oc create configmap prom --from-file=prometheus.yaml
oc set volume deployment/prometheus --add -t configmap --configmap-name=prom -m /etc/prometheus/prometheus.yml --sub-path=prometheus.yaml
oc rollout status -w deployment/prometheusAdd sum(pipeline_predictions_total) by (app, value) to monitoring metrics
oc new-app grafana/grafana
oc expose service/grafana
Add prometheus dashboard in grafana using:
http://prometheus.ai-ml-demo:9090Add sum(model_pipeline_predictions_total) by (app, value) to monitoring metrics and create your own dashboard in Prometheus and Grafana
Sample board to use : https://raw.githubusercontent.com/hanvitha/breastcancer_detection/master/Breast%20Cancer%20Model%20Metrics-grafana_dashboard.json
- In order to test the app is all up and running, download images from testimages folder and download the images(you can clone the repo if needed)
- Our model is around 70% accurate so it can detect malignancy most of the times but not always.
- From UI, upload/drop the test image. and click on Get Prediction.
- You will see the prediction below the button. It can take a couple of seconds as it needs to process the image.
- Image names with postfix _0 are benign -absent of cancer cells, and _1 are malign for your reference. You can change names if you like.
- You can see how your model is working from grafana dashboard.
Thanks for going through my demo.This is purely my personal demo created to show Opensource value to my customers. Please reach out to me on my LinkedIn
