CS2952 Homework : A project to test performance differences of different asynchronous I/O
The target I/O library : sync, native aio, posix io and io_uring
-
BPF Compiler Collection(BCC)
Install from source code. See tutorial here
And enable USDT
$ sudo apt-get install systemtap-sdt-dev
-
Flexible I/O Tester(fio)
See tutorial here
-
Flame Graph and perf
For detailed usage : here
$ git clone https://github.com/brendangregg/FlameGraph
$ sudo apt install linux-tools-common
-
Install IO library
$ sudo apt-get install libaio-dev
$ git clone https://github.com/axboe/liburing.git
$ cd liburing && make && make all
$ sudo cp -r ../liburing /usr/share
$ sudo cp src/liburing.so.2.2 /usr/lib/x86_64-linux-gnu/liburing.so
$ sudo cp src/liburing.so.2.2 /usr/lib/x86_64-linux-gnu/liburing.so.2
We focus on the latency and IOPS (I/O Operations Per Second) performance of I/O library(sync, native aio, posix io and io_uring) which may be two main dimensions that people are concerned about. And all tests are done with flag O_DIRECT in order to avoid cache interference except small read/write operations imitating zero-delay cases.
-
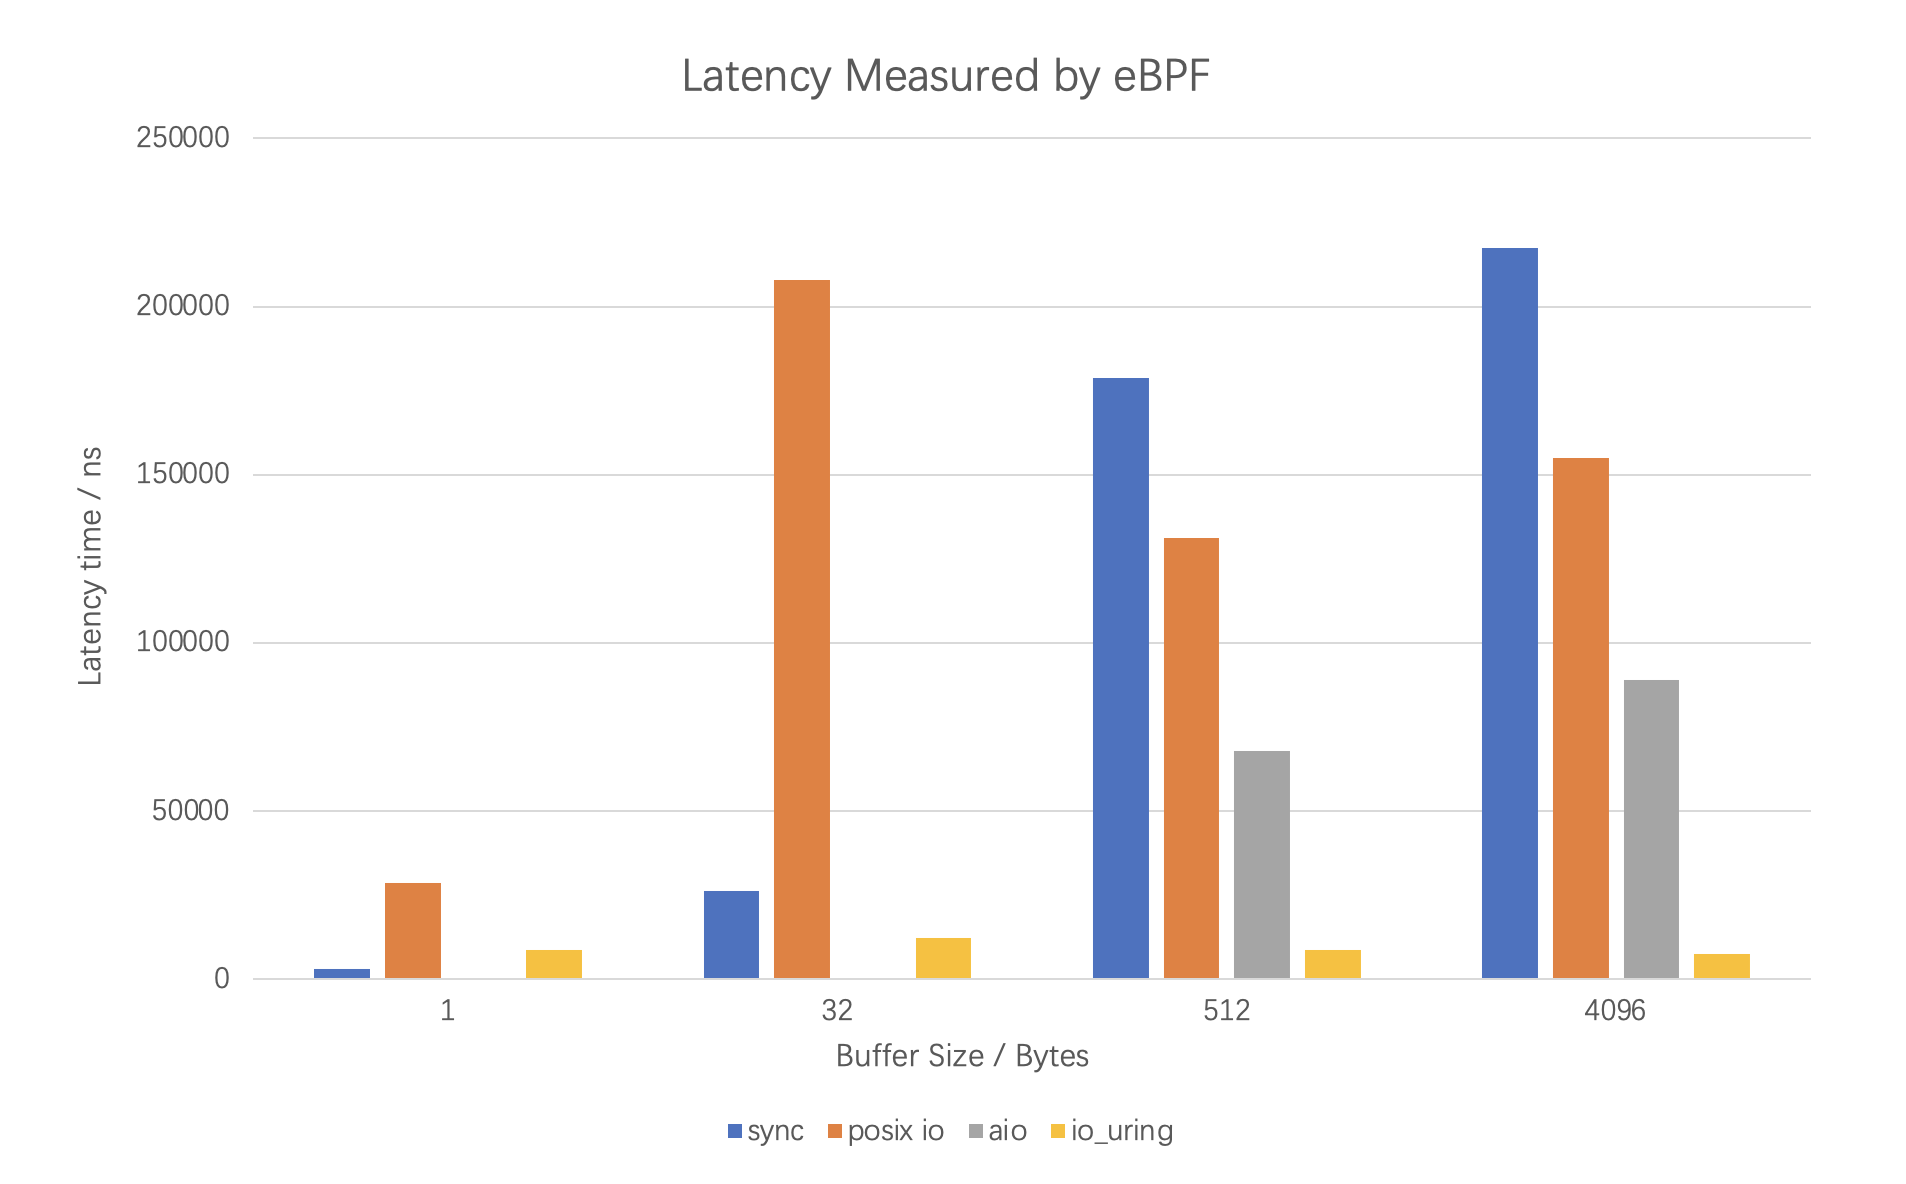
Latency
BCC is used to write eBPF tracing program to detect the running time of specific kernel functions, user functions and code segments. Namely uprobe and uretprobe are used to catch I/O library functions. USDT are defined to trace specific code segments. For example : (code in
src/bpfCode.candsrc/test.py)b.attach_uprobe(name="uring", sym="io_uring_submit", fn_name="bpf_iouring_submit_in") b.attach_uretprobe(name="uring", sym="io_uring_submit", fn_name="bpf_iouring_submit_out")
-
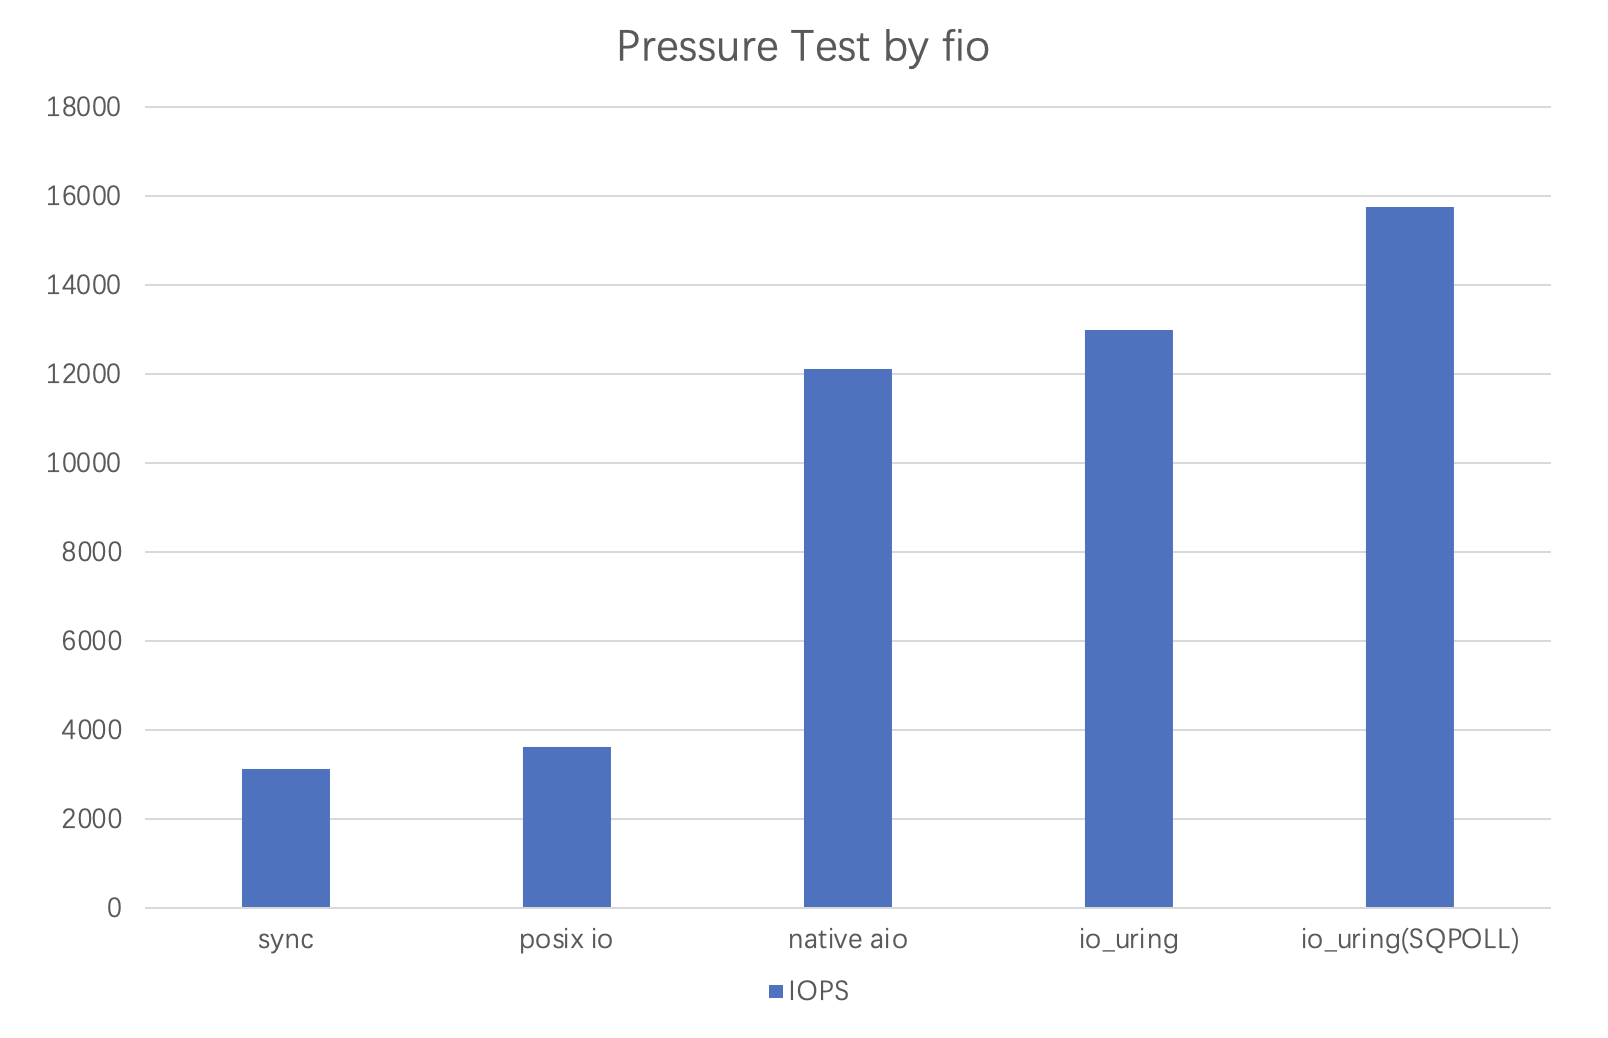
Throughput(IOPS)
Fio is used to perform pressure testing on different I/O library. We control the parameters to implement the comparison experiment. The detailed instruction is in
res/bench.md. The sample is below :dreamer@ubuntu:~/Desktop/try/bench$ fio -thread -size=1G -bs=4k -direct=1 -rw=randwrite -name=test -group_reporting -filename=./io.tmp -runtime 600 --ioengine=io_uring --iodepth=128 -
Call Stack Analysis
We use perf and FlameGraph to generate the flame graph of the procedure.
$ sudo perf record -F 99 -p `pid of test program` -g -- sleep 30
$ sudo perf script -i perf.data &> perf.unfold
$ sudo ./FlameGraph/stackcollapse-perf.pl perf.unfold &> perf.folded
$ sudo ./FlameGraph/flamegraph.pl perf.folded > perf.svg
And the sample graph is like :
The following are personal opinions, which maybe a little naive.
Note: We use IOPS to denote throughput because they differ by only one factor.
Assuming the bottom block device has a constant and robust read/write speed
For sync I/O, we can simply construct the cost model as a linear
So a natural intuition is utilizing one syscall (or something has cost) for a batch of I/O operations, which converts the linear
The reason why io_submit or io_uring_enter, which means larger coefficient in
Theoretical analysis shows
The original target for designing asynchronous architecture is to avoid blocking, which is expensive when device gets faster and programs gets more complex. CPU is released to undertake other meaningful work. So non-blocking is an essential way for I/O operation. There are many ways to implement non-blocking. Posix I/O uses thread pools to initialize set of helper threads. The main thread dispatches the I/O requests to many helper threads which will block to carry on the operations while the main thread get non-blocking function call. However, there is no pie in the sky. The cost of doing this is the mess of concurrency (like IPC or shared resources) and context switching. So the actual improvement is not significant with unbearable bugs introduced.
Another way to implement non-blocking I/O is like io_uring. The essence of the approach is to leave some of the work to the io_uring module in the kernel to avoid syscalls by setting a io_uring context with shared memory. The shared memory area consists of SQE and CQE which are two circular queue (in other word, single producer single consumer) to transfer information between user and kernel without risk of compete race. The user thread just put the I/O request on the free entry of SQE and then either the kernel io_uring is notified or the kernel io_uring is radical to find it (case in SQPOLL).
Theoretical analysis shows
Something wrong with my aio library leading to high latency in this case
We can find that the experiment fits well with the theoretical analysis when the amount of data is large. But when the buffer size is smaller, the sync I/O get smaller latency. That is because under the case of hot cache hit or small read/write operations the real operation cost is small enough to catch up the cost of asynchronous operations. Under this circumstance, the sync is better.
We can see that the trend is to leave some of the work to modules in the kernel and to handle the cost of information exchange. Like io_uring works like a courier, you leave the item at the door, io_uring picks up the operation and puts it back. From this point of view io_uring is an almost perfect design. Future work may appear at reducing the useless data copy between kernel and user.

