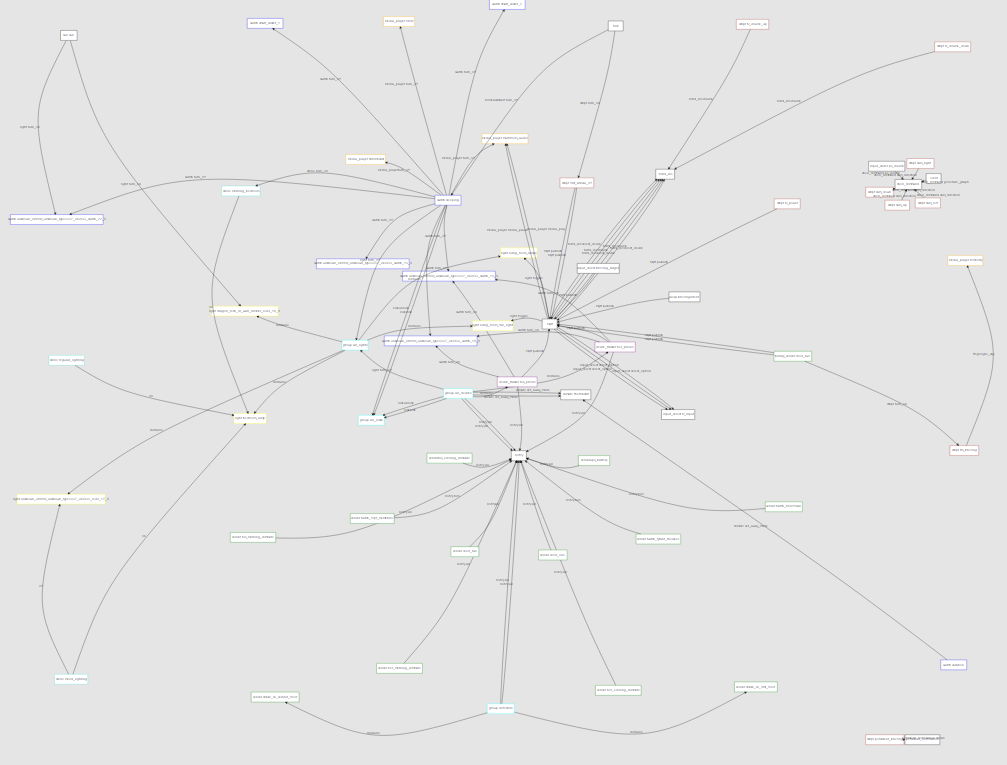
https://happyleavesaoc.github.io/hagraph.html
Install graphviz:
yum install graphviz graphviz-devel      # RHEL/CentOS
apt-get install graphviz graphviz-dev    # Ubuntu/Rasbian
Install hagraph:
pip install hagraph
Errors about pygraphviz? Try:
pip install git+https://github.com/pygraphviz/pygraphviz.git --install-option="--include-path=/usr/include/graphviz" --install-option="--library-path=/usr/lib/graphviz/"
python3 -m hagraph -i <path/to/configuration.yaml> -o <path/to/output.[dot/png/jpg/svg/etc]>
panel_iframe:
  graph:
    title: Graph
    icon: mdi:vector-polyline
    url: "https://your.hass/local/graph.html"

shell_command:
  generate_graph: "python3 -m hagraph -i <path/to/configuration.yaml> -o <path/to/www/>graph.svg"

automation:
  - alias: Generate graph
    trigger:
      platform: event
      event_type: homeassistant_start
    action:
- service: shell_command.generate_graphIn your <Home Assistant configuration directory>/www:
<html>
<script src="/local/svg-pan-zoom.min.js"></script>
<head>
        <meta http-equiv="cache-control" content="max-age=0" />
        <meta http-equiv="cache-control" content="no-cache" />
        <meta http-equiv="expires" content="0" />
        <meta http-equiv="expires" content="Tue, 01 Jan 1980 1:00:00 GMT" />
        <meta http-equiv="pragma" content="no-cache" />
        <style>
                body { margin: 0; padding: 0; }
        </style>
</head>
<body>
<object id="graph" data="/local/graph.svg" type="image/svg+xml" style="width: 100%; height: 100%; background-color: #E5E5E5">
</object>
    <script>
      window.onload = function() {
        svgPanZoom('#graph', {
          controlIconsEnabled: false,
          zoomScaleSensitivity: 0.7,
          minZoom: 1
        });
      };
    </script>
</body>
</html>
Be sure to get svg-pan-zoom.min.js as well.
