Develop an application to demonstrate how the Automotive Industry could harness data to take informed decisions. Demonstrate the use of data analytics in identifying: Customer segments, Most popular car specification combination (engine type, fuel, mileage, etc), Right time to launch a new car, etc Any other queries you can think of
- I divided the project into 3 phases : research, basic working prototype, addition of features.
- In the research phase I began by selecting a dataset from Kaggle. Then I learnt how to use Power BI and plotted some basic graphs to try out different possibilities.
- In the second phase, I started developing the React app. I started with the data analysis part simultaneously as well. I made some basic reports on Power BI and embedded them into the React application. I divided the cars into 5 customer segments using the K-Means algorithm. By the end of this phase I had a working application with a responsive front-end.
- In the last phase I completed all the 5 reports and started out with the Sales Prediction part. After some research I was able to implement Multivariate Linear Regression to predict sales based on independent input variables.
- Once the model was working I implemented basic functionalities in javascript to compute the expected sales using the Linear Regression model when the user provides car specifications.
Please note that you will need node.js installed on your machine to run this project.
- open the terminal in
Data Analysis Projectfolder. - type
cd automobile_industry_analysisin the terminal and press enter. - type
npm iin the terminal and press enter. Wait for the packages to download and install. - finally enter
npm startin the ternminal to run the app on port 3000.
Presentation explaining the basic features of the application.
This project uses a data set consisting of various features like price, sales, horsepower, curbweight, mileage, etc. of 205 cars.
link to the data set: Data Set
One of the reports also uses an additional list of countrywise sales. This list is also present as a separate sheet in the above provided excel file.
The dataset found on Kaggle did not have sales data, so I added the sales data corresponding to each car from Carsalesbase
Python's Pandas library has been used for data cleaning. All the code is present in ./data/data_cleaning.ipynb
Some of the cars had missing sales data so those were removed from the data set
- used one-hot encoding for features with non integer values like carbody type, fuel, etc.
- ran k-means clustering on the dataset
- identified each cluster as a customer segment based on it's unique feature sets.
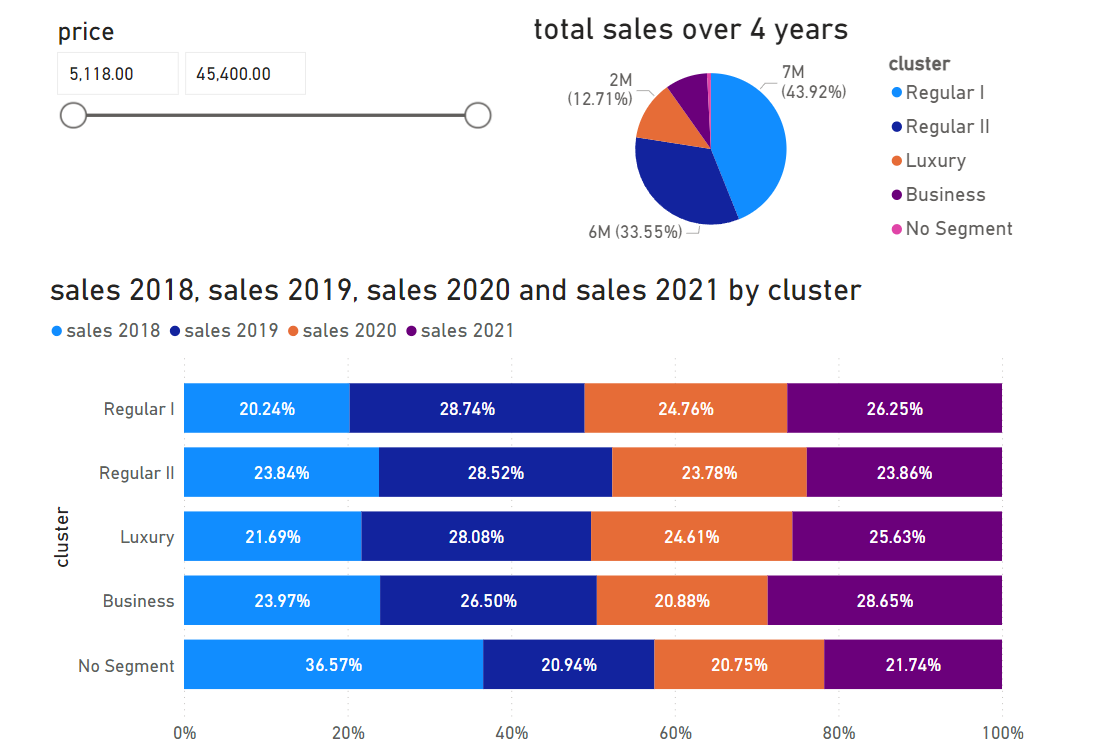
- The following 5 customer segments were identified : 'Regular I', 'Regular II', 'Business', 'Luxury' and 'No Segment'.
- The cars belonging to 'No Segment' are the ones which don't fit into any of the other 4 segments. These have the common property of relatively low sales.
The Sales prediction feature is implemented on top of a Linear Regression model. The model was trained on the given dataset of 205 cars and uses a total of 15 features, like curbweight, doornumber, enginetype, fuel, etc. as independent variables that are linearly affecting the sales of the car which in this case is our dependent variable.
The React Application renders 5 Power BI reports each aimed at analysing the data from a different perspective (like sales, primary features, etc.). Power BI reports have been embedded into the webpage using the 'Publish to Web' service provided by Power BI. These embeds support fully interactive graphs and plots equipped with features like data slicing. All the inferences drawn from a particular Power BI dashboard are summarized on it's side (on pc) or just below it (on phone). Each report consists of multiple dashboards (22 in total). The slider window contains one slide for each dashboard in the same order. Therefore to view the inferences for a certain dashboard number (let's say x) the user needs to navigate to the same slide number (that is x) in the slider window. Each report is also accompained by a description on top of the inferences slider window which provides a basic insight into the objective of the report.
The web application is built on React.js which is JavaScript library. React provides with efficient ways to create interactive UIs and renders just the right components when the data changes. Partitioning the code into components helps in debugging. Instead of rewriting the code for each report, the same report component is re-rendered with different props (which are like arguments in a function) using react.
Power BI is a data visualization tool and an industry standard for plotting interactive graphs to analyse data. All the reports were prepared in Power BI and then published on to the web and then embedded in the React application. These reports are interactive and provide a deep insight into the data.
Python provides a vast number of inbuilt libraries which are extensively used for Data Analysis and Machine Learning. This project makes use of sklearn, numpy and pandas. Pandas was used for data cleaning, feature engineering and model training. Multivariate Linear Regression was implemented using the sklearn library.
- I would like to analyse real-time data. At present the dashboards are static in the sense that they would not automatically update in case the dataset changes. I would like to automate data visualization so that the dashboards update whenever a change in the databse is reported.
- In the future I plan on improving the 'PREDICT SALES' feature by implementing an Artificial Neural Network instead of a Multivariate Linear Regression Model to increase the accuracy of predictions.
