| Type | Scale | Example |
|---|---|---|
| Quanittative / numerical continous | Continous | Height of students in a class |
| Quantitave / numerical discrete | Discrete | Number of students in a class |
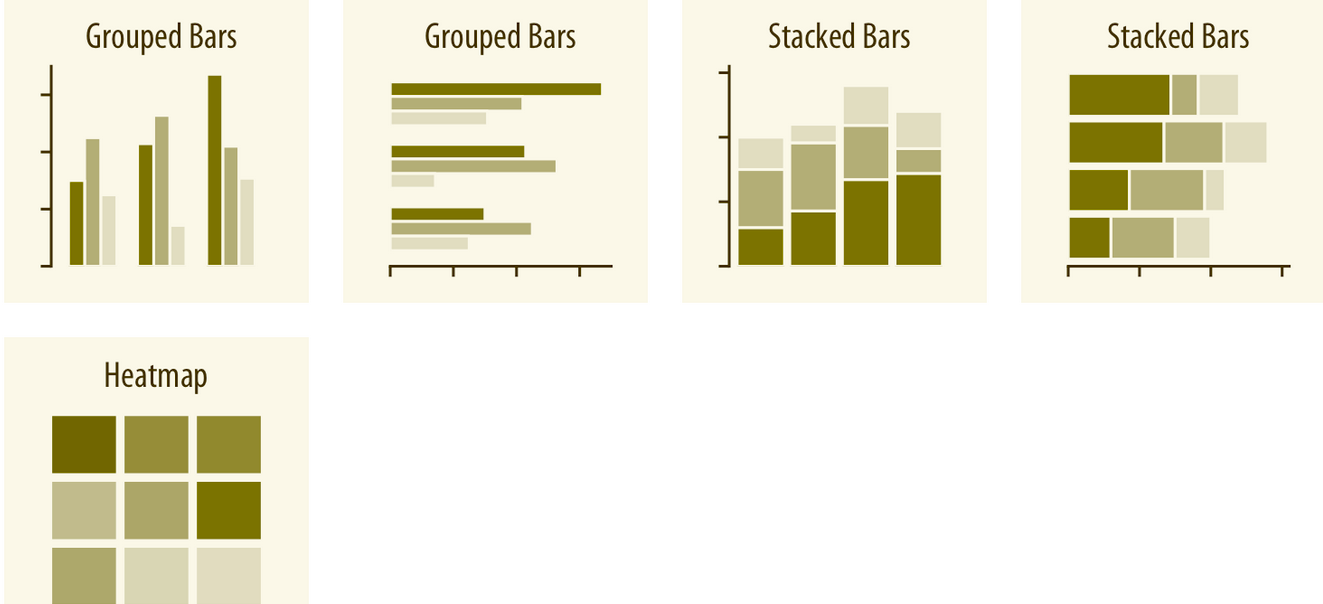
| Qualitative / categorically unordered | Discrete | Cat, Dog, Fish |
| Qualitative / categorically ordered | Discrete | good, fair, poor |
| Date or Time | Discrete or Cont | 25 Jan, 20 dec 2021 |
| Text | None or discrete | 'My name is Hardik' |
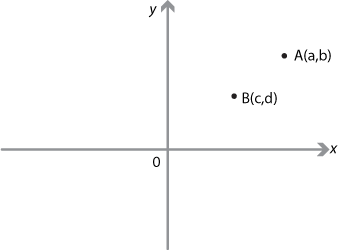
- The traditional x and y coordinate system.
- If X and Y are measured in same units, then they must have same spacing between ticks.
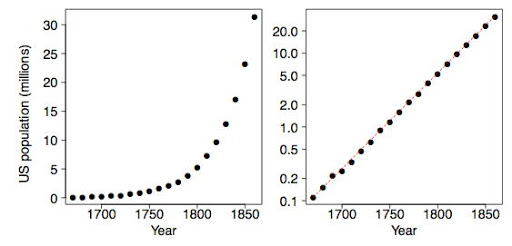
- We transform the value of a given axis, using functions like log, square root.
- This is useful to suite the graph according to the story, or when the range of the values of quite large.
- Also used to display the values which uses mulitplication or division in them.


