A second version of Harmony is in development as an API at https://github.com/harmonydata/harmony
Harmony is a data harmonisation project that uses Natural Language Processing to help researchers make better use of existing data from different studies by supporting them with the harmonisation of various measures and items used in different studies. Harmony is a collaboration project between the University of Ulster, University College London, the Universidade Federal de Santa Maria in Brazil, and Fast Data Science Ltd.
You can read more at https://harmonydata.org.
There is a live demo at: https://app.harmonydata.org/
This front end is based on the Dash Food Footprint demo: https://dash.gallery/dash-food-footprint/
Runs on Dash interactive Python framework developed by Plotly.
Developed by Thomas Wood / Fast Data Science thomas@fastdatascience.com
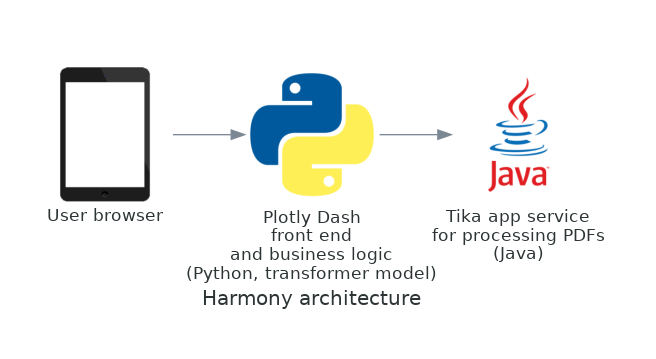
This tool is written in Python using the Dash front end library and the Java library Tika for reading PDFs, and runs on Linux, Mac, and Windows, and can be deployed as a web app using Docker.
Harmony compares questions from different instruments by converting them to a vector representation and calculating their similarity. You can read more at https://harmonydata.org/how-does-harmony-work/
We have defined a data schema in accordance with the FAIR principles.
Questionnaires are represented within Harmony in a tabular format.
The file name is the unique identifier of a questionnaire, e.g. GAD-7 English.csv.
Files are tab-separated with the following columns:
- Question No: Alphanumeric, the question ID from the original questionnaire.
- Question: The text of the question
- Options: Any options or Likert scale such as "very often", "more than usual", etc
- Install Docker.
- Open a command line or Terminal window. Change folder to where you downloaded and unzipped the repository, and go to the folder
front_end. Run the following command:
docker build -t harmony
docker run harmony
- Open your browser at
https://localhost:80. You will see the web app running.
In command line, if you have installed Azure CLI, log into both the Azure Portal and Azure Container Registry:
az login
az acr login --name regprotocolsfds
If the admin user is not yet enabled, you can use the command:
az acr update -n regprotocolsfds --admin-enabled true
Run this script:
./build_deploy.sh
cd into data/raw_pdf and run download_raw_pdfs.sh.
Download and install Java if you don't have it already. Download and install Apache Tika and run it on your computer https://tika.apache.org/download.html
java -jar tika-server-standard-2.3.0.jar
(the version number of your Jar file name may differ.)
Install everything in requirements.txt:
pip install -r requirements.txt
Go into front_end and run
python application.py
You can then open your browser at localhost:8050 and you will see the tool.
- Dash - Main server and interactive components
- Plotly Python - Used to create the interactive plots
- Docker - Used for deployment to the web
- Apache Tika - Used for parsing PDFs to text
- spaCy - Used for NLP analysis
- NLTK - Used for NLP analysis
- Scikit-Learn - Used for machine learning
- Apache Tika: Apache 2.0 License
- spaCy: MIT License
- NLTK: Apache 2.0 License
- Scikit-Learn: BSD 3-Clause
- Deploying a Dash webapp via Docker to Azure: https://medium.com/swlh/deploy-a-dash-application-in-azure-using-docker-ed46c4b9d2b2

