Is there a data visualization that ggplot2 can't recreate? Let's find out!
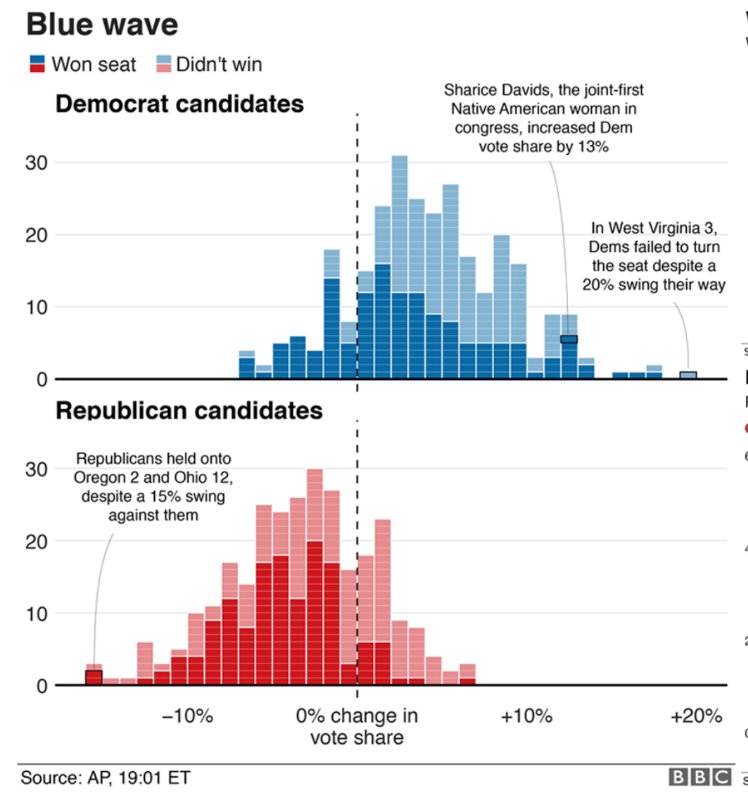
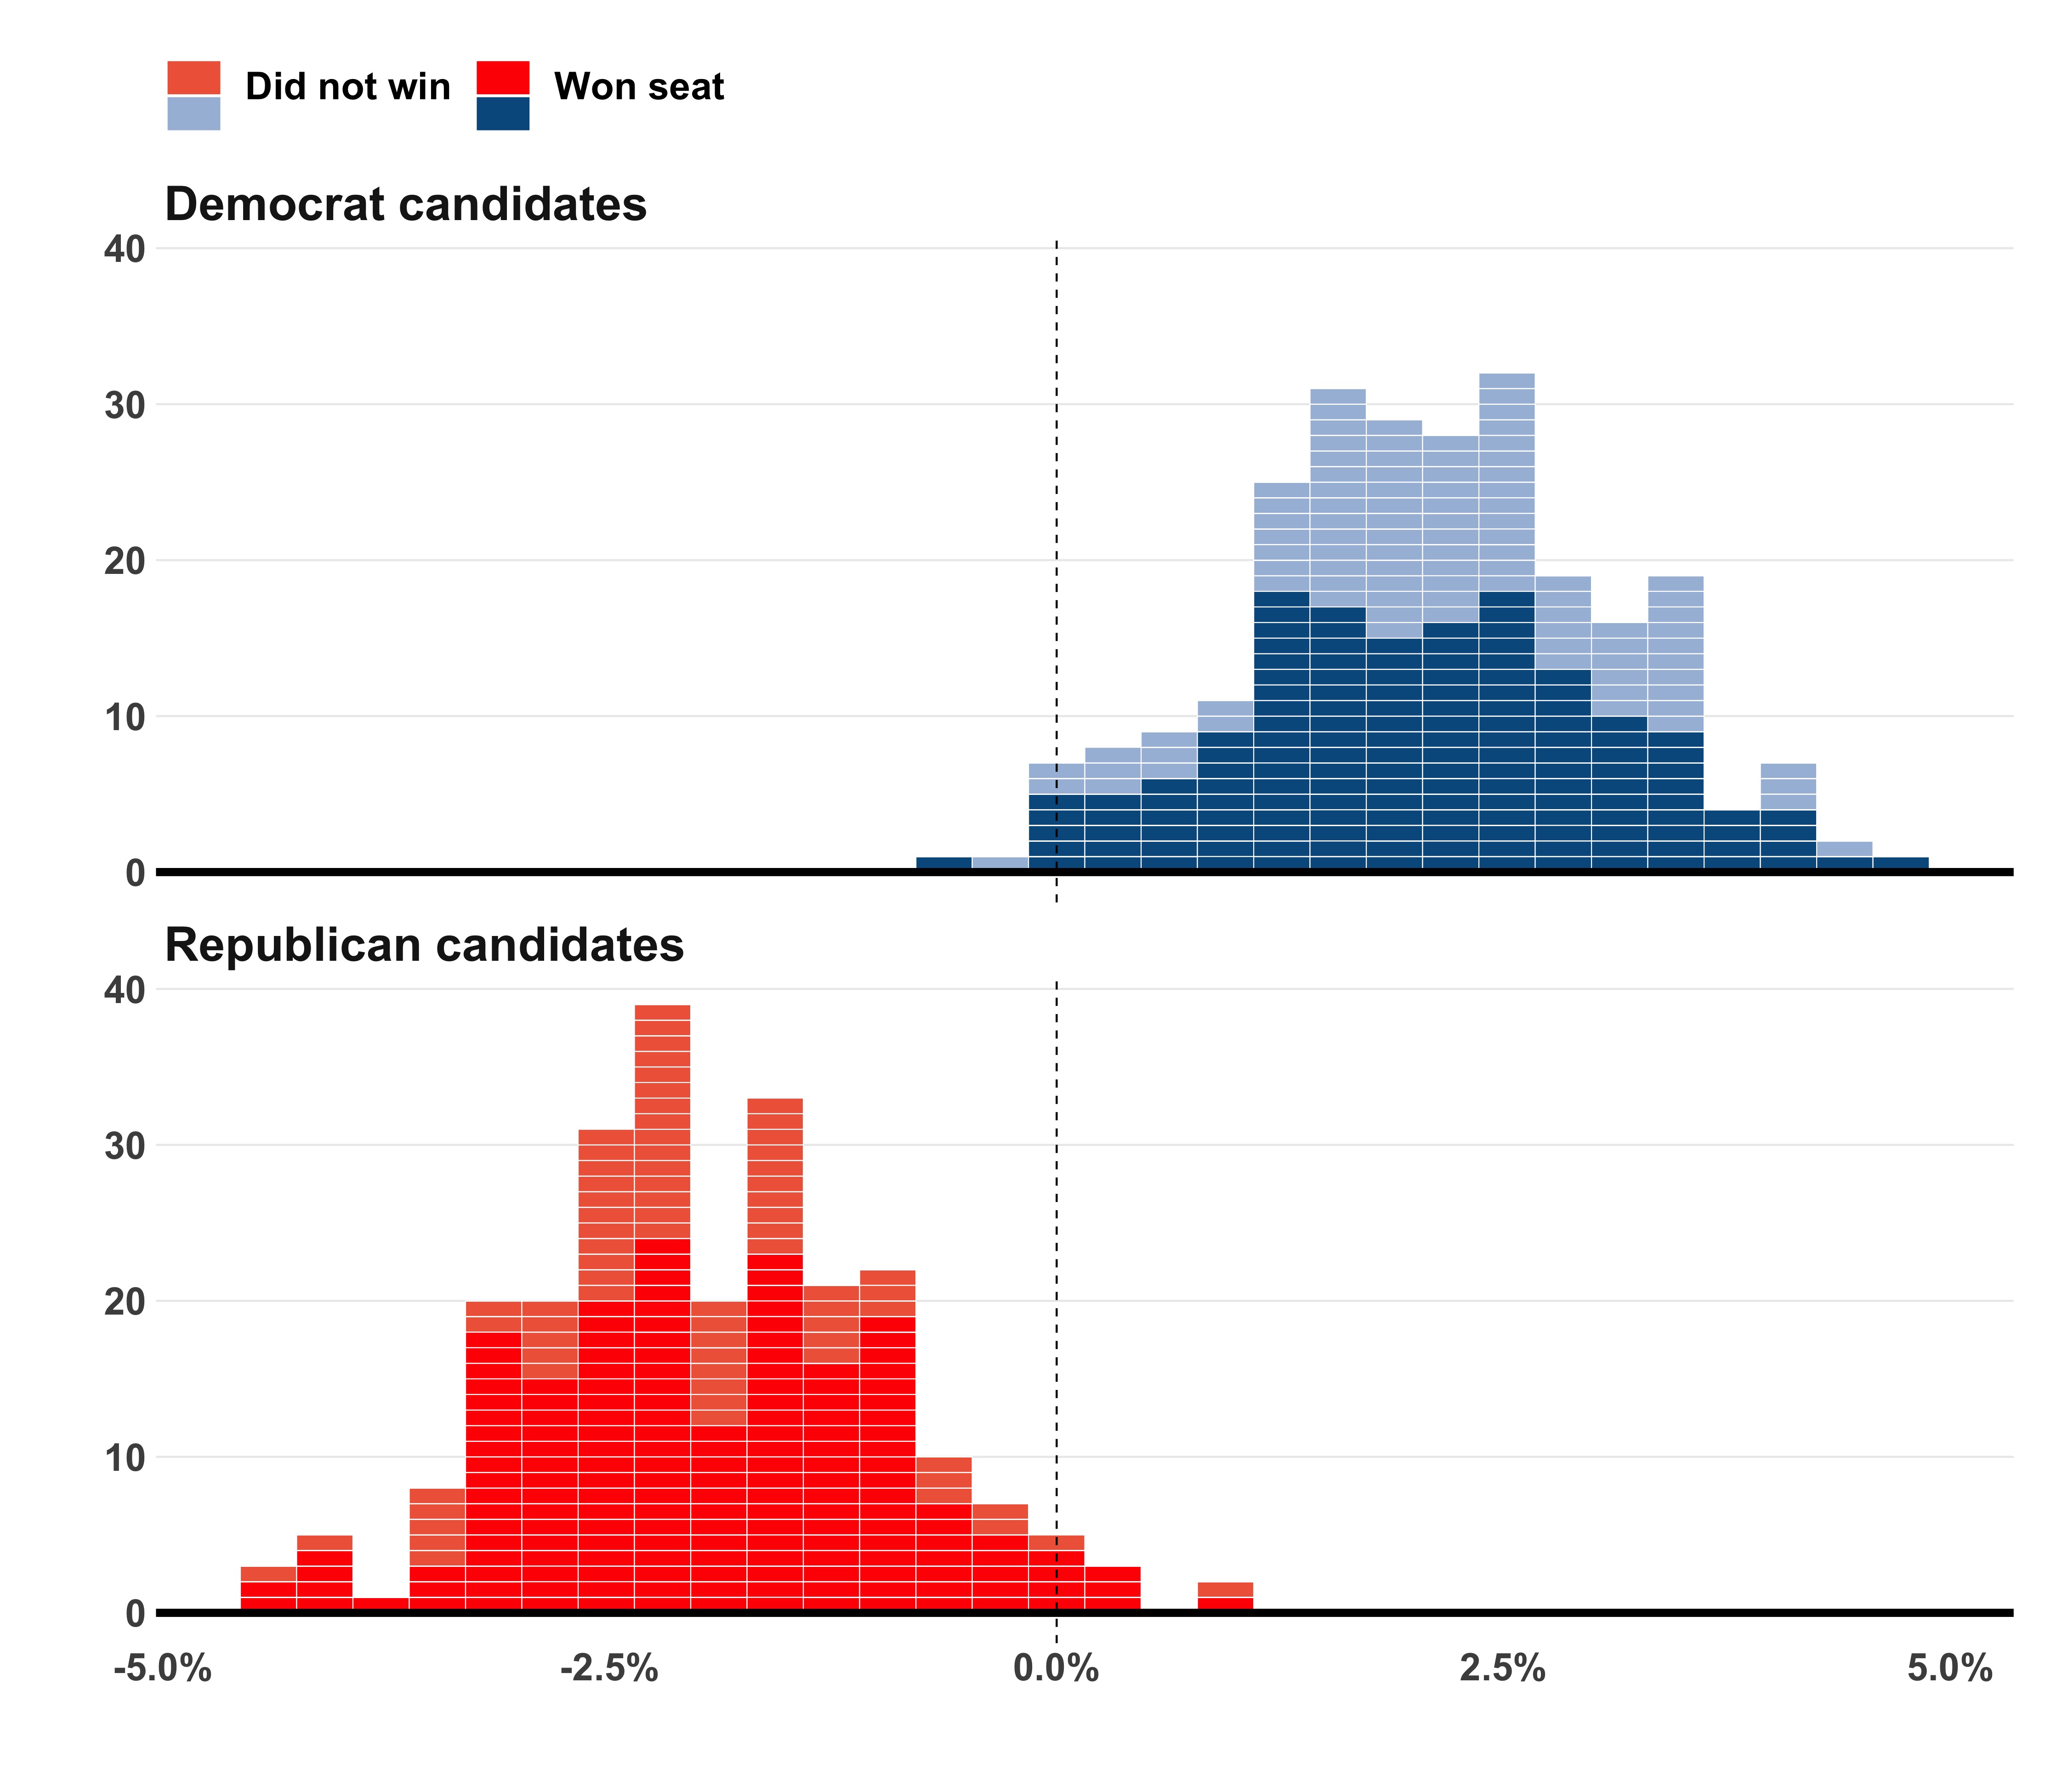
I select charts that aren't originally made in R and rcreate them.
Suggestions of visualizations, feedback, or contributions are absolutely welcomed via twitter or PR.
(Also, no copyright intended, just a repo for testing skills in R)
Originals on the left and recreated ones on the right.
| original | rcreated |
|---|---|
 |
 |
| original | rcreated |
|---|---|
 |
 |
