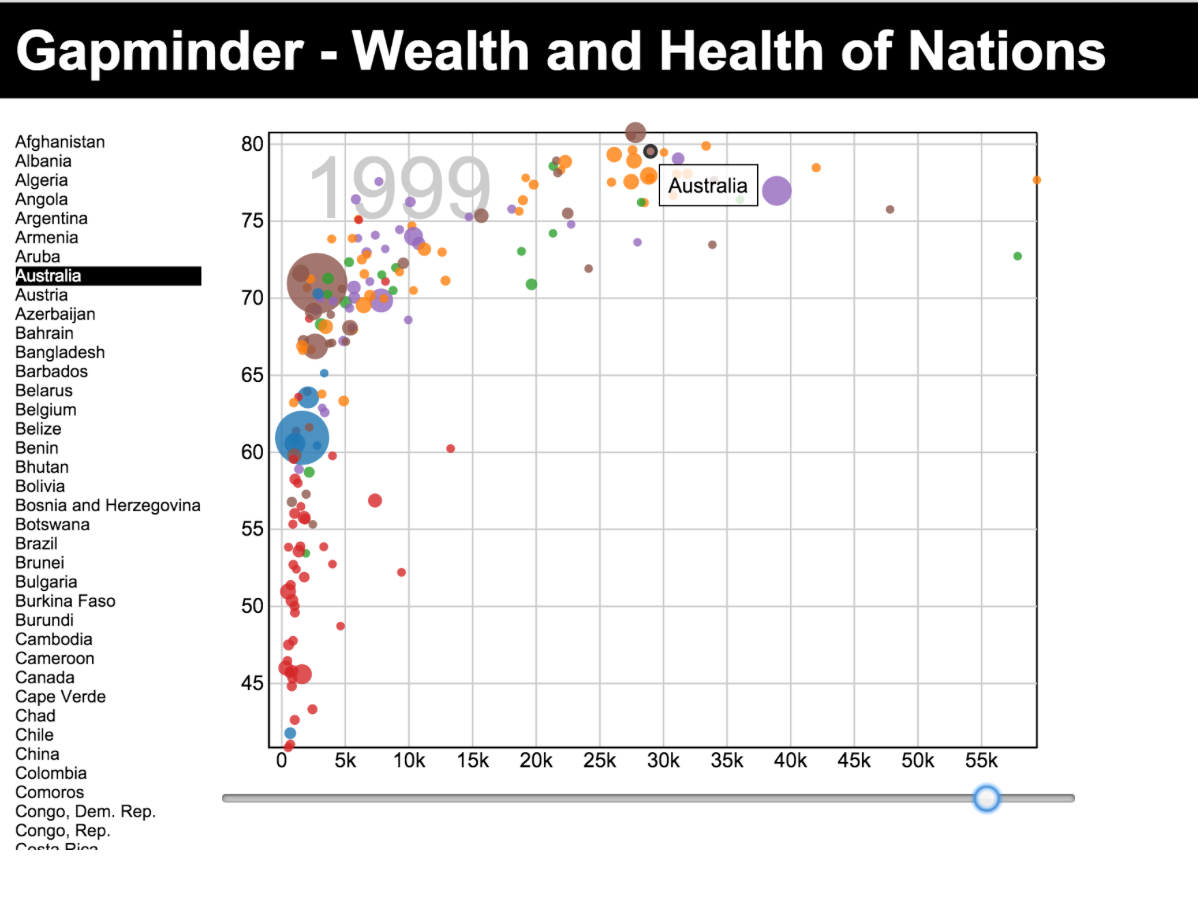
A D3 visualization of countries using their GDP, Population and other factors.
- Harshit Pareek - Software Engineer - 😎 💻
This is image of the visualization of all countries with a list of countries on the left and a plot on the left where x-axis depicts population, y-axis depicts GDP.
This project is licensed under the MIT License - see the LICENSE.md file for details
