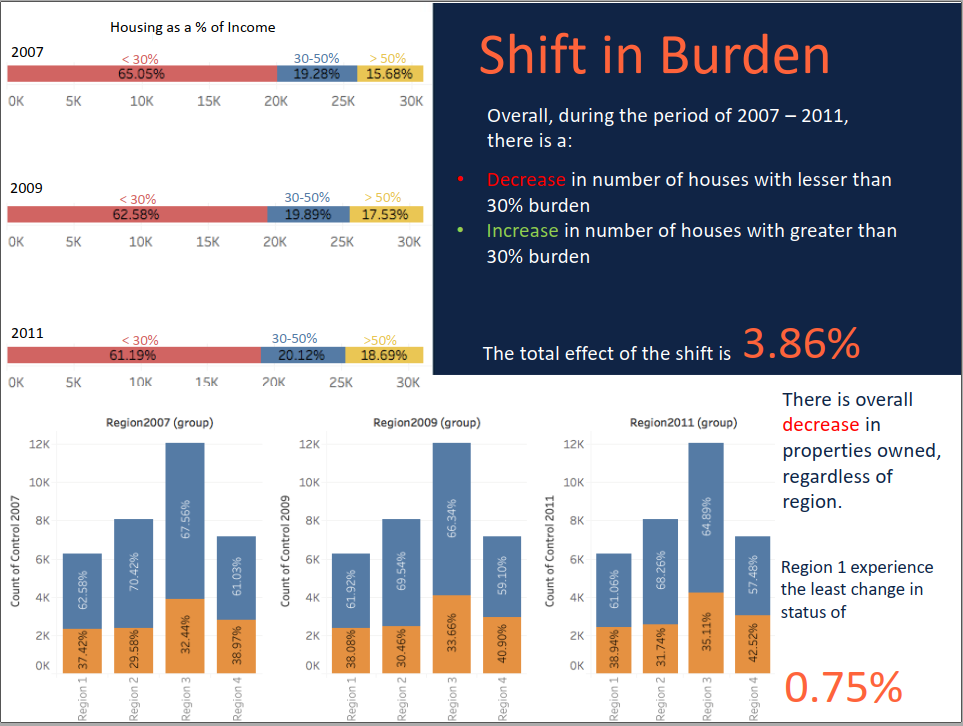
An analysis of the housing and rent prices in the United States before and after the 2008 Housing Bubble. The project was completed in 6 hours as part of final Hackathon Round of Intelligence Analytics Challenge 3.0 at the University of Texas at Dallas. The entire summary of the project can be found in the project report.
The data-set consists of details about various houses across and its ownership status across the United States from the year 2003-2013 for every alternate year. The data has been used to answer various questions related to the US housing market.
The entire presentation of the project can be found here.
- Microsoft R -version 3.4.3
- Tableau - version 10.5
- Microsoft Excel
The data used for exploratory analysis and model building can be found here. The visualizations can be replicated using Tableau.
- Visualized housing and renting prices across America using Tableau to understand the impacts of the housing bubble.
- Derived yearly trend for house prices for various locations and illustrated regions with profitable housing property.
- Determined the impact of poverty on house ownership, debt burden, and occupancy of people in a room.
Project is: finished and we did win the second position if the analytics challenge. Our project for the previous round can be found here. Be sure to check it out.
Created with my teammates Weiyang Sun and Sri Harish Popuri Team Random.
If you loved what you read here and feel like we can collaborate to produce some exciting stuff, or if you just want to shoot a question, please feel free to connect with me on email, LinkedIn, or Twitter. My other projects can be found here.


