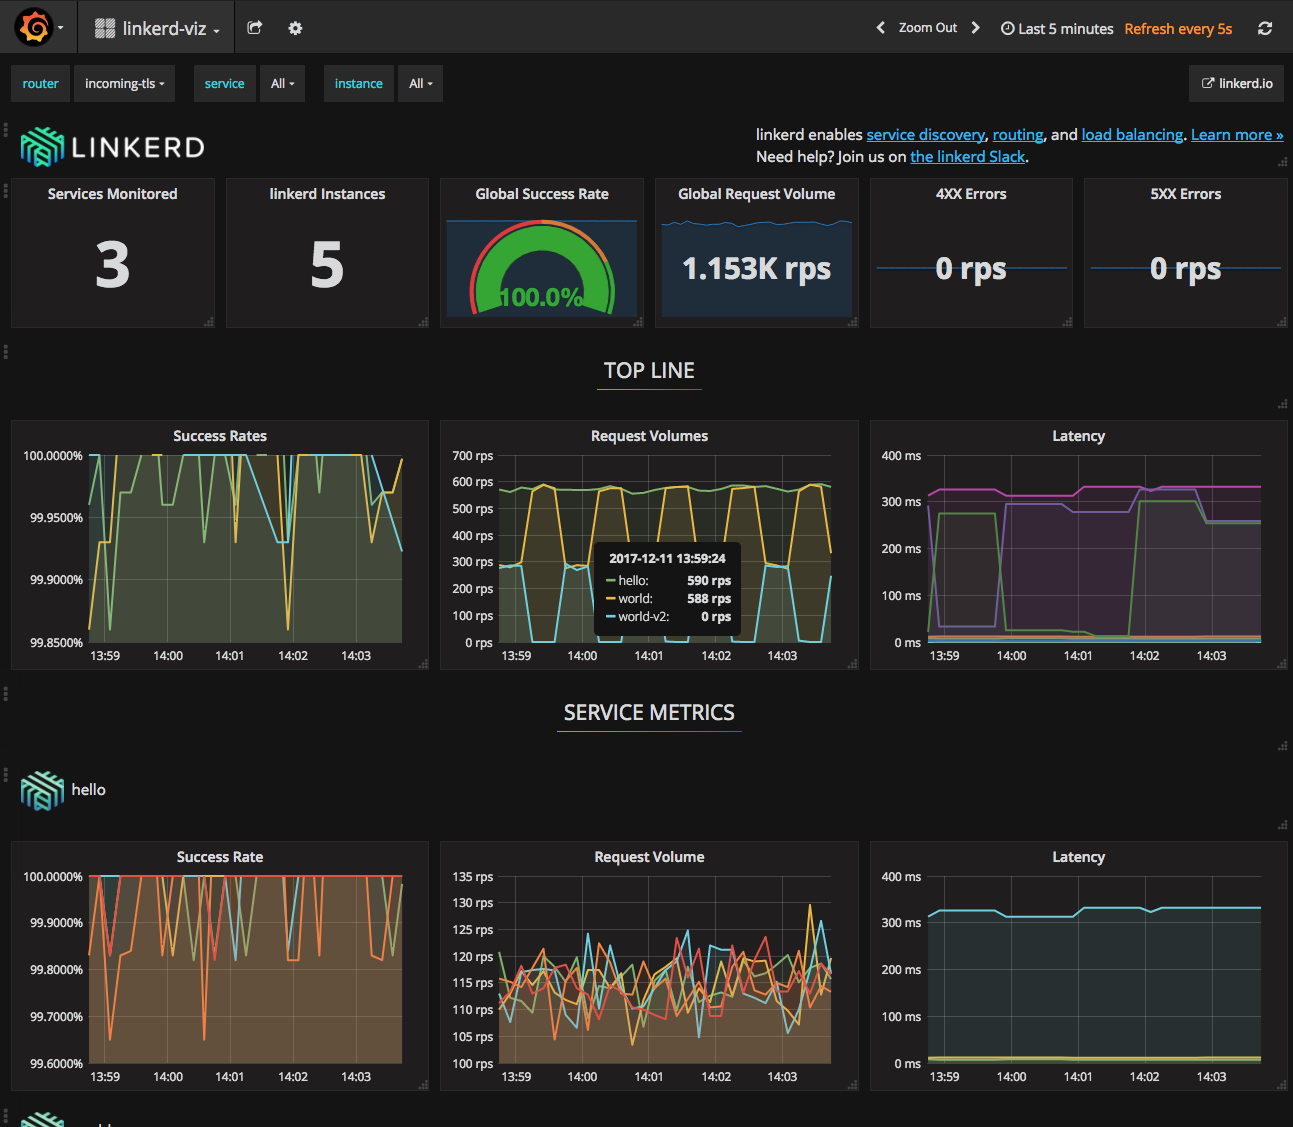
Dead simple monitoring for linkerd.
linkerd-viz is a monitoring application based on Prometheus and Grafana, autoconfigured to collect metrics from linkerd. linkerd-viz currently supports DC/OS and Kubernetes.
linkerd-viz assumes linkerd has already been deployed onto your cluster, and
your applications have been configured to route via linkerd. You'll also need
to configure linkerd with the io.l5d.prometheus telemeter, to expose the stats
that are displayed by linkerd-viz. You should add this block to your linkerd
configuration file:
telemetry:
- kind: io.l5d.prometheus
For more information on getting started with linkerd have a look at our Getting Started guides.
docker build -t buoyantio/linkerd-viz:latest .docker run -p 3000:3000 -p 9191:9191 buoyantio/linkerd-vizInstall the official linkerd-viz DC/OS Universe package
dcos package install linkerd-vizCustom installation
dcos marathon app add dcos/linkerd-viz.jsonView dashboard
open $PUBLIC_NODE:3000kubectl apply -f k8s/linkerd-viz.ymlView dashboard
open http://$(kubectl get svc linkerd-viz -o jsonpath="{.status.loadBalancer.ingress[0].*}")First, examine and edit consul/prometheus-consul.yml to fit your ecosystem.
Run the Consul agent locally:
docker run -d --net=host -e 'CONSUL_LOCAL_CONFIG={"leave_on_terminate": true}' consul agent -bind=<external ip> -retry-join=<root agent ip>for more information see Running Consul Agent in Client Mode.
Boot linkerd-viz locally:
docker run -p 3000:3000 -p 9191:9191 buoyantio/linkerd-viz consulView dashboard
open localhost:3000For more deployment instructions, see the mesos-marathon configs in the linkerd-examples repo.

