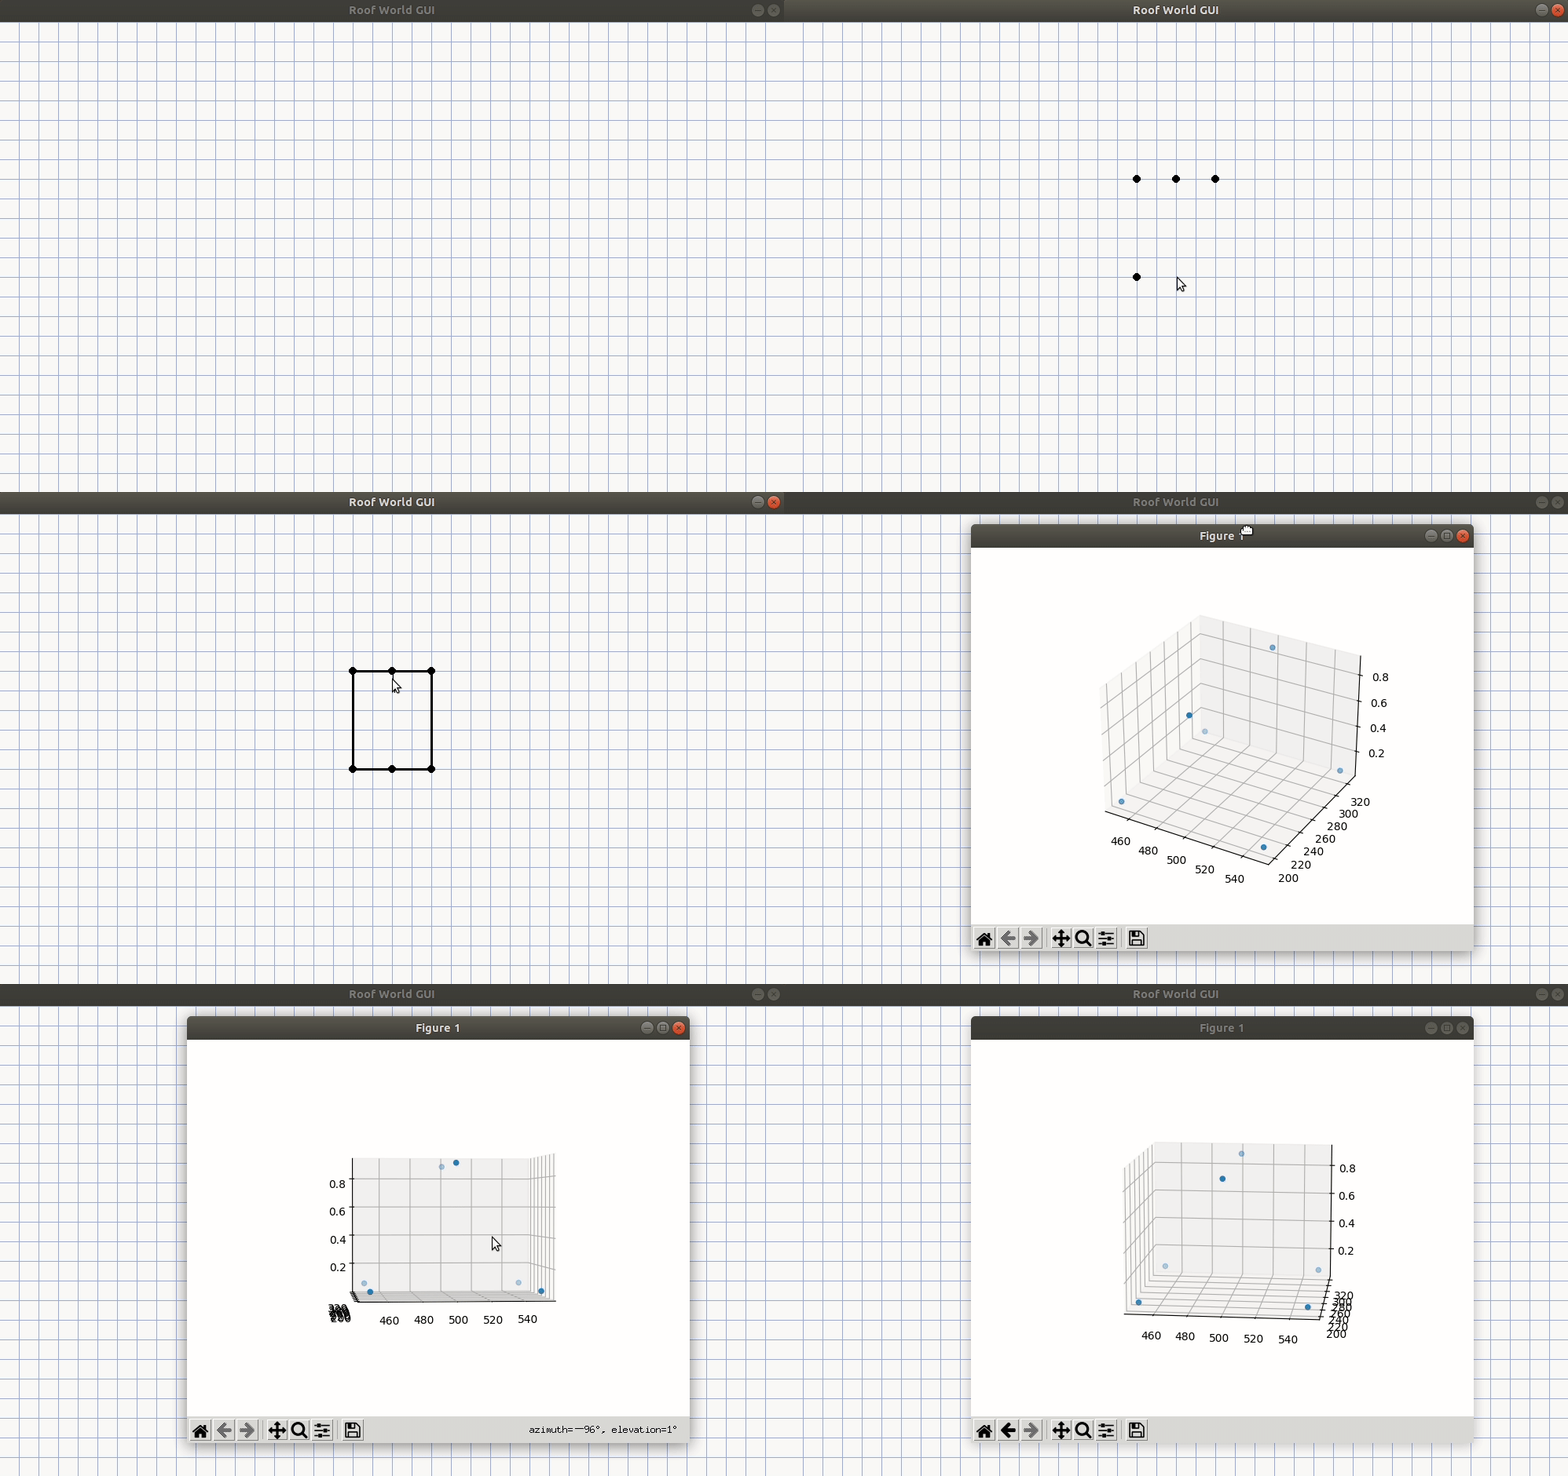
Inferring 3D structure from 2D graphs.
# python >= 3.10
pip install -r requirements.txtpython gui.pyBasic GUI Usage:
- Left click to add a point
- Right click on a point to start drawing a line, Right click on another point to connect them
- Press p on your keyboard to run prediction and produce a 3D plot showing the probability of each point being a "high point"
Other useful features:
- Left click on a point to toggle black/orange color (orange represents a high point, black represents "all other points") for creating training data
- CTRL-z: Undo
- ESCAPE: Quit "line drawing" mode
- c: (C)lear all points and lines
- s: (S)ave the current state to the
saved/directory - b: (B)ackground toggle (turn the graph paper on or off, useful for taking screenshots)
- d: (D)ump internal state to the console, showing the predicate logic representation
The saved/ directory contains 20 building layouts. Running estimate_performance.py estimates 5-fold cross-validation
for predicting whether a point is a high point.
python estimate_performance.pypython find_lines.py docs/one_roof.png
