This is a website that can log data from a fitness tracker and present it on a user dashboard. A user will be able to see their latest activity data, goals, and milestones.
This project was completed as a project at Turing School of Software & Design during Module 2.
A challenge was working on APIs, as this is the first lesson at Turing where this came up.
Referencing those datasets through the API was definitely a learning experience.
Written in JavaScript (Mocha, Chai), HTML, & CSS
Built with Visual Studio Code & Atom
Enter the following command in the Terminal:
git clone https://github.com/hayleyw7/fitlit.git
Enter the following command in the Terminal:
cd fitlit
Enter the following command in the Terminal:
npm install
Enter the following command in the Terminal:
npm start
Enter the following command in the Terminal:
git clone https://github.com/turingschool-examples/fitlit-api.git
Enter the following command in the Terminal:
cd fitlit-api
Enter the following command in the Terminal:
npm install
Enter the following command in the Terminal:
npm start
Enter the following URL in your internet browser:
http://localhost:8080/
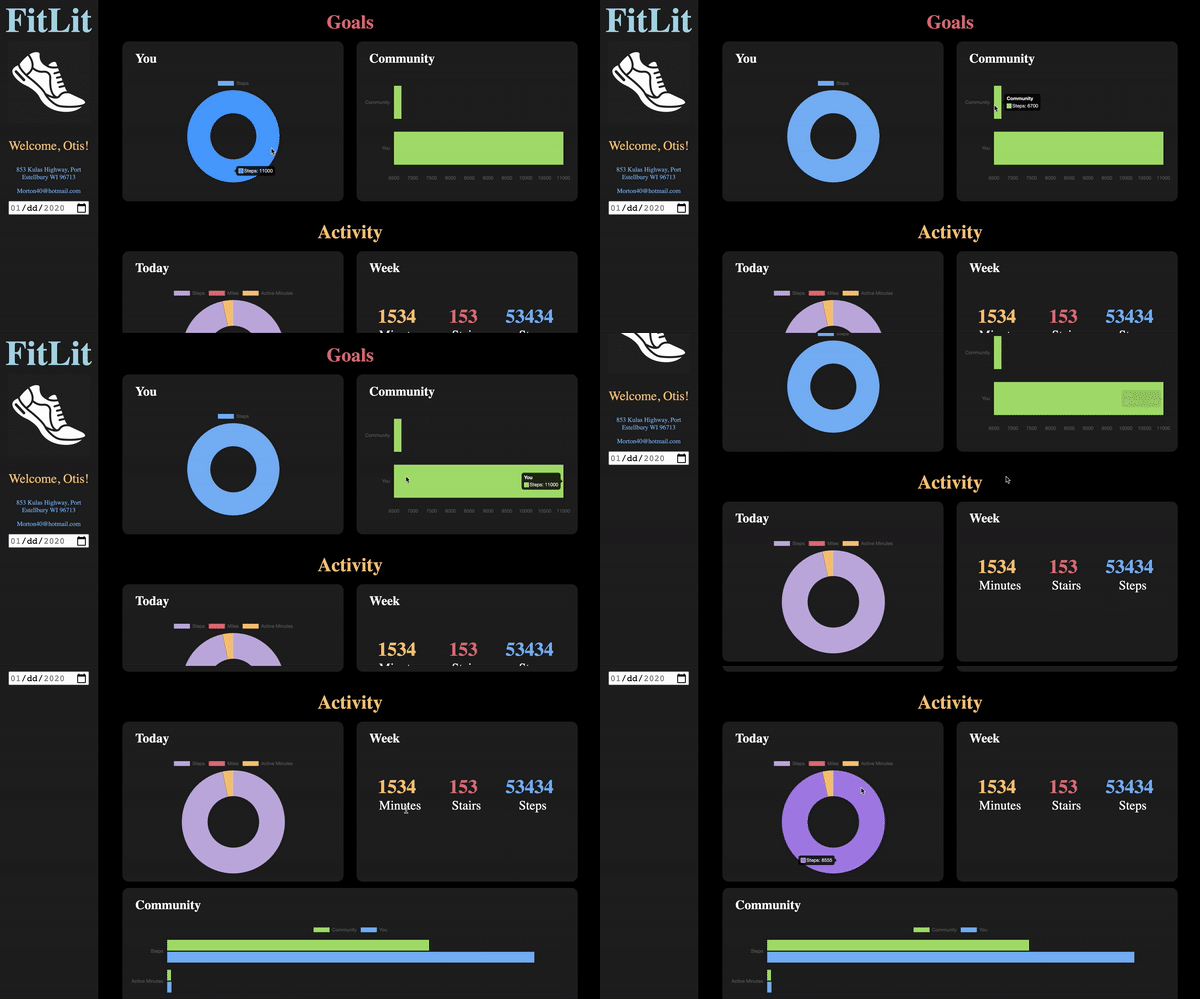
When the site loads, a user will see two colorful sections: sidebar and widgets.
After opening the website, the user will be greeted by name. The sidebar also includes their contact information, as well as a calendar. The calendar can be used to access the data of a specific time period.
The user will be able to see their Goals, Activity, Hydration, and Sleep data in separate sections. Each section includes widgets with either a) labelled numbers, or b) graphs, over which a user can hover to see specific numbers and headings. These widgets are regularly updated through the day, week, month, and beyond.
-
The Goals section includes a chart of the user's daily step goal and a chart comparing it to the average step goal of the website's community.
-
The Activity section includes a left graph of the user's steps, miles, and active minutes during the current day. The top right of the section contains the same data, but for the week in numbers. Underneath, there is a bar graph comparing the data community-wide.
-
In the Hydration section, the left chart contains the amount of water consumed today, and the right chart contains that data from the last week, separated by date.
-
For Sleep, the top left chart displays you sleep quality and hours slept last night, the respective weekly numbers are next to it, and the all-time numbers are below.
-
The user will be able to design a step challenge between friends.
-
The user will have the ability to select the widgets that they always want to see at the top of the page.
Project completed by Fara Akhatova & Hayley Witherell
Project designed by, Travis Rollins, Khalid Williams, Brittany Dionigi, Robbie Jaeger, & Hannah Hudson
