नागराज-भक्षकः नकुलः
This is an advanced, scalable monitoring system built with Python and Tornado. It consists of a server that collects and stores metrics, and a client that gathers and sends metrics to the server.
- 100% Python implementation - absolutely no PHP or other legacy languages in sight
- Modern, from-the-ground-up design - not built on a 20-year-old core
- Server-client architecture for distributed monitoring
- Shared-secret signature-based communication between server and client
- Extensible metric collection through custom Python scripts
- All metrics are implemented natively in Python, allowing for easy customization and extension
- PostgreSQL database for robust and scalable storage of metrics
- In-memory queue system for efficient metric processing
- Client-side buffering for resilience against network issues
- Advanced data aggregation for handling thousands of hosts
- RESTful API for fetching latest metrics and historical data
- Automatic cleanup and aggregation of old data
- Configurable alert system with support for downtimes
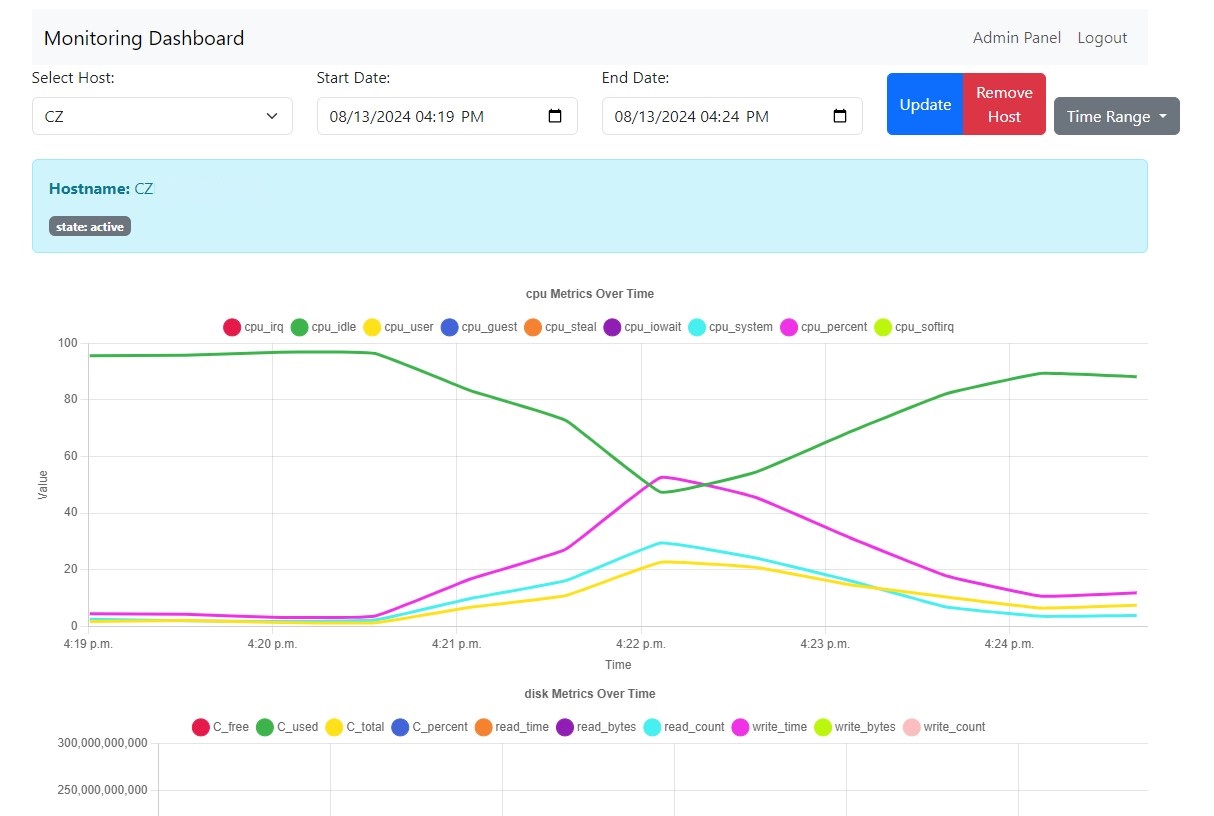
- Interactive dashboard with real-time updates
- URL-based host selection for easy sharing and bookmarking
- Host tagging system for better organization
- Admin interface for managing clients and uploading new metrics
- Data simulation tool for testing and development
- Flexible data management, including the ability to selectively delete metrics when needed
- Pure Python implementation, making it easy to understand, modify, and extend the entire system
- Dynamic metric selection with perioid rediscovery and remote or local configuration
- End-to-end monitoring including Selenium, Autoit, PyAutoGUI supporting elements, positional clicking, bitmap synchronization (OCR)
- Python 3.7+
- Tornado web framework
- PostgreSQL database
- psycopg2-binary (PostgreSQL adapter for Python)
- Chart.js (for dashboard visualizations)
- Clone this repository or download the source files.
- Install the required packages:
pip install tornado psycopg2-binary - Ensure you have PostgreSQL installed and running.
-
Server Setup:
- Create a
server_config.jsonfile with your database and server settings. - Run the server using:
python server.py
- Create a
-
Client Setup:
- Create a metrics directory in the same location as client.py
- Add custom Python scripts to the metrics directory for each metric you want to collect
- Configure
client_config.jsonwith appropriate settings (see Configuration section) - Run the client using:
python client.py
Update your client_config.json file to include the following new fields:
{
    "client_id": "",
    "server_url": "http://localhost:8888",
    "default_interval": 60,
    "metrics_dir": "./metrics",
    "secret_key": "your_secret_key",
    "active_metrics": ["cpu_usage", "memory_usage", "disk_usage"],
    "metric_intervals": {
        "cpu_usage": 30,
        "memory_usage": 60,
        "disk_usage": 300
    },
    "tags": {
        "environment": "production",
        "role": "webserver"
    }
}active_metrics: List of metrics that should be collected. Only metrics in this list will be gathered and sent to the server.metric_intervals: Custom collection intervals for specific metrics (in seconds). If not specified, thedefault_intervalwill be used.
-
Create a new Python file in the
metricsdirectory (e.g.,custom_metric.py). -
Implement a
collect()function that returns the metric value:def collect(): metrics = {} # Handling system_1 try: metrics["system_1"] = { "value": 123 } except Exception as e: metrics["system_1"] = { "value": None, "message": f"UnexpectedError: {str(e)}" } # Handling system_2 try: metrics["system_2"] = { "value": 456 } except Exception as e: metrics["system_2"] = { "value": None, "message": f"UnexpectedError: {str(e)}" } return metrics
-
Add the metric name to the
active_metricslist inclient_config.json.
To enable or disable metrics without restarting the client:
- Update the
active_metricslist inclient_config.json. - The client will automatically detect the change and adjust its metric collection accordingly on the next update cycle.
Access the dashboard at http://localhost:8888/dashboard. Features include:
- Real-time metric visualizations
- Host selection with URL-based sharing
- Alert configuration and management
- Downtime scheduling
Access the admin interface at http://localhost:8888/admin. Features include:
- Client configuration management
- Metric script uploading
- Host tag management
- Active metric configuration
GET /: Check if the server is runningPOST /metrics: Submit metrics (used by the client)GET /fetch/latest: Get the latest metrics for all hostsGET /fetch/history/<hostname>/<metric_name>: Get historical data for a specific metricGET /fetch/hosts: Get a list of all hostsPOST /alert_config: Configure alertsPOST /alert_state: Update alert stateGET /downtime: Get downtime informationPOST /downtime: Schedule a downtimeGET /fetch/recent_alerts: Get recent alertsPOST /aggregate: Trigger manual data aggregationPOST /remove_host: Remove a host from the systemPOST /update_tags: Update tags for a hostGET /client_config: Fetch client configurationPOST /client_config: Register or update client configuration
Nakulos is available for commercial use under a separate commercial license. Companies interested in using Nakulos for their monitoring needs can contact us at cyphernormie@gmail.com to discuss pricing and support options. We offer flexible plans tailored to the specific requirements of businesses of all sizes.
Benefits of the commercial plan include:
- Priority support and dedicated account management
- Access to additional enterprise features and integrations
- SLA guarantees for uptime and performance
- Assistance with setup, migration, and customization
- Option for on-premises or private cloud deployment
Please note that commercial use of Nakulos without a valid commercial license is not permitted under the open-source license detailed below.
- If metrics are not being collected, check the
active_metricslist in your client configuration. - Ensure that all custom metric scripts have a
collect()function. - Check the client logs for any errors related to metric collection or script loading.
Contributions are welcome! Please feel free to submit a Pull Request.
This project is licensed under the Creative Commons Attribution-NonCommercial 4.0 International License (CC BY-NC 4.0).
For more details about this license, please visit: https://creativecommons.org/licenses/by-nc/4.0/
