This is a pandoc filter that converts dot code into latex-friendly PGF/TikZ. It is basically just a wrapper for dot2tex .
Because of the nature of the PGF/TikZ format, this filter is only suitable for exporting to latex and pdf. Rendering to PGF/TikZ gives a better-looking result in pdfs than using a raster image. If you want to convert a document containing dot graphs to different formats, check out the graphviz filter from the pandocfilters package, which renders the graphs to pngs end embeds them in the output document.
Run:
pip install pandocfiltersto install the Python pandocfilters libraryapt-get install dot2tex
$> pandoc source.md --filter ./path/to/dot2tex-filter.py -H ./path/to/tikz-preamble.latex -t output.pdf
Important! By default, pandoc's latex template does not include the tikz package in the document preamble. To change that, either:
- edit the default template, so it contains this code:
\usepackage{tikz} \usetikzlibrary{shapes,arrows} - tell pandoc to embed the
tikz-preamble.latex(included in this repository) in the document's preamble, by adding-H ./path/to/tikz-preamble.latexto thepandoccommand.
In following examples, I'll use Markdown as the source language.
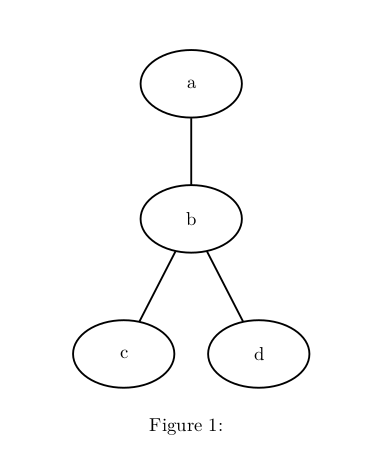
To create a basic graph, create a fenced code block with a dot class, like so:
```dot
graph graphname{
	a -- b -- c
	b -- d
}
```
The result will be:
If you want to add a caption, you should use a slightly different syntax:
```{.dot caption="This is a graph"}
graph graphname{
	a -- b -- c
	b -- c
}
```
The value of the caption can contain any tex tokens and it will be properly rendered.
```{.dot caption="foo bar \alpha \beta"}
graph graphname{
	a -- b -- c
	b -- c
}
```
The graph will be rendered as a figure. If you want to reference the figure somewhere in your document, you need to give the graph a label, like so:
```{.dot caption="My graph" label="my_graph"}
graph graphname{
	a -- b -- c
	b -- c
}
```
To reference the graph, use
\ref{my_graph}
directly in paragraph test - it will be properly interpreted by pandoc and rendered as expected.
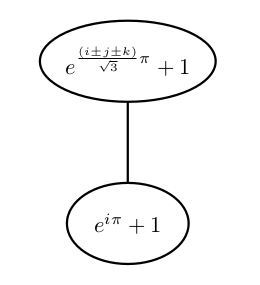
You can use full math mode inside a node's label. See example:
```dot
graph graphname{
	a [texlbl="$\sum_{k=0}^{n-1} e^{2 \pi i k/n}$"];
	b [texlbl="$e^{\frac{(i \pm j \pm k)}{\sqrt 3}\pi} + 1$"];
	a -- b
}
```
If the graph does not fit in your page, use the scale attribute:
```{.dot scale="0.5"}
graphname tall{
	a -- b -- c -- d -- e -- f
}
```
It will make the distance between the nodes shorter, but it won't scale the label text.
If you want to learn more about dot2tex-specific graph attributes, check out this article

