This repo houses the private, city-facing dashboard that integrates AirQ indicators and weekly COVID updates:
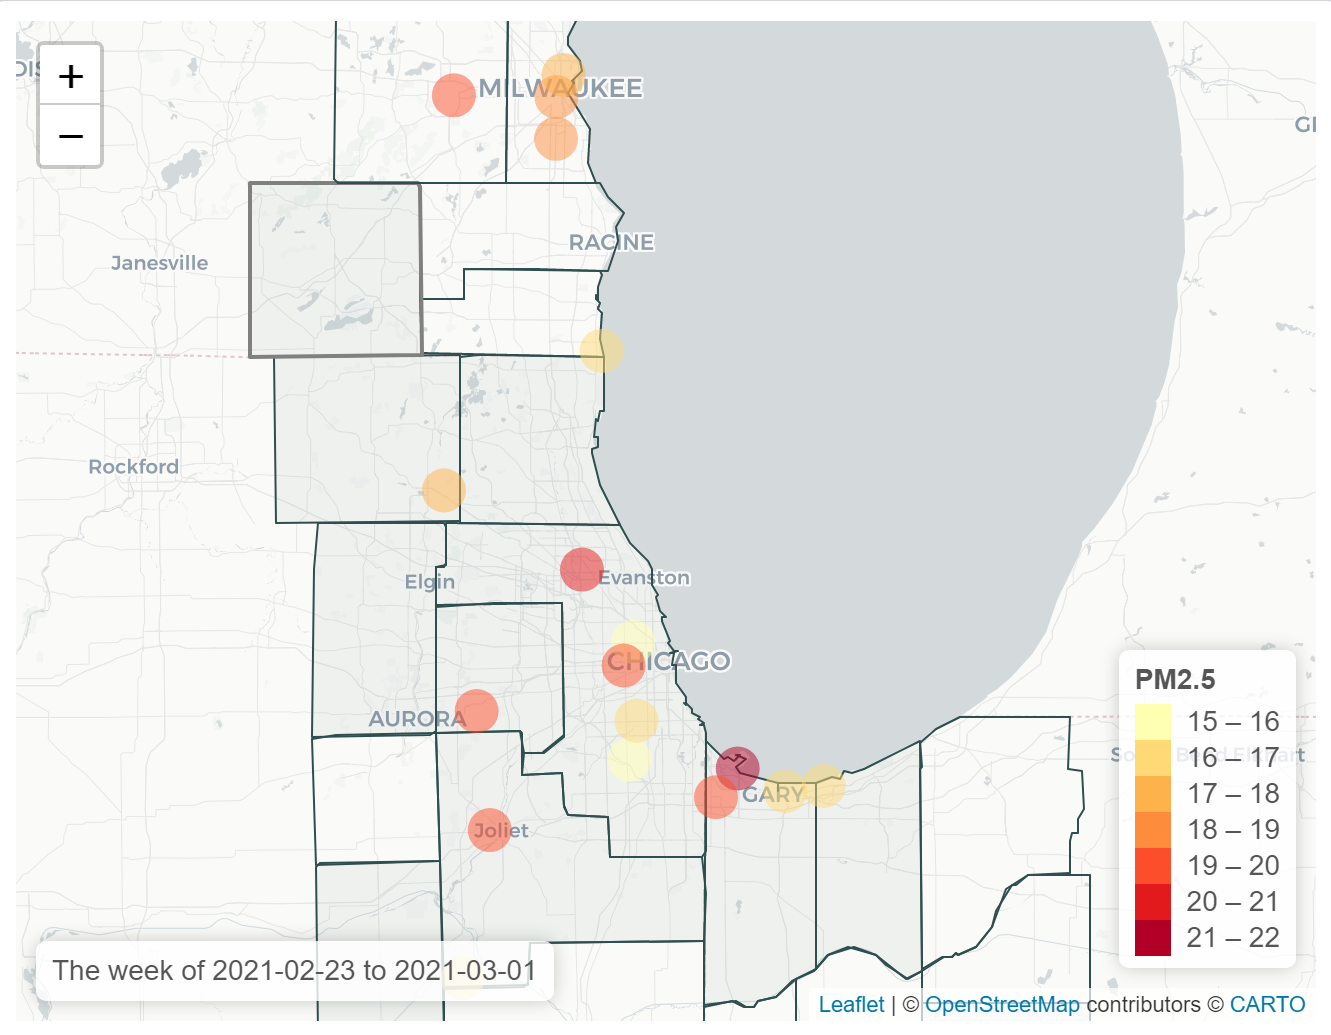
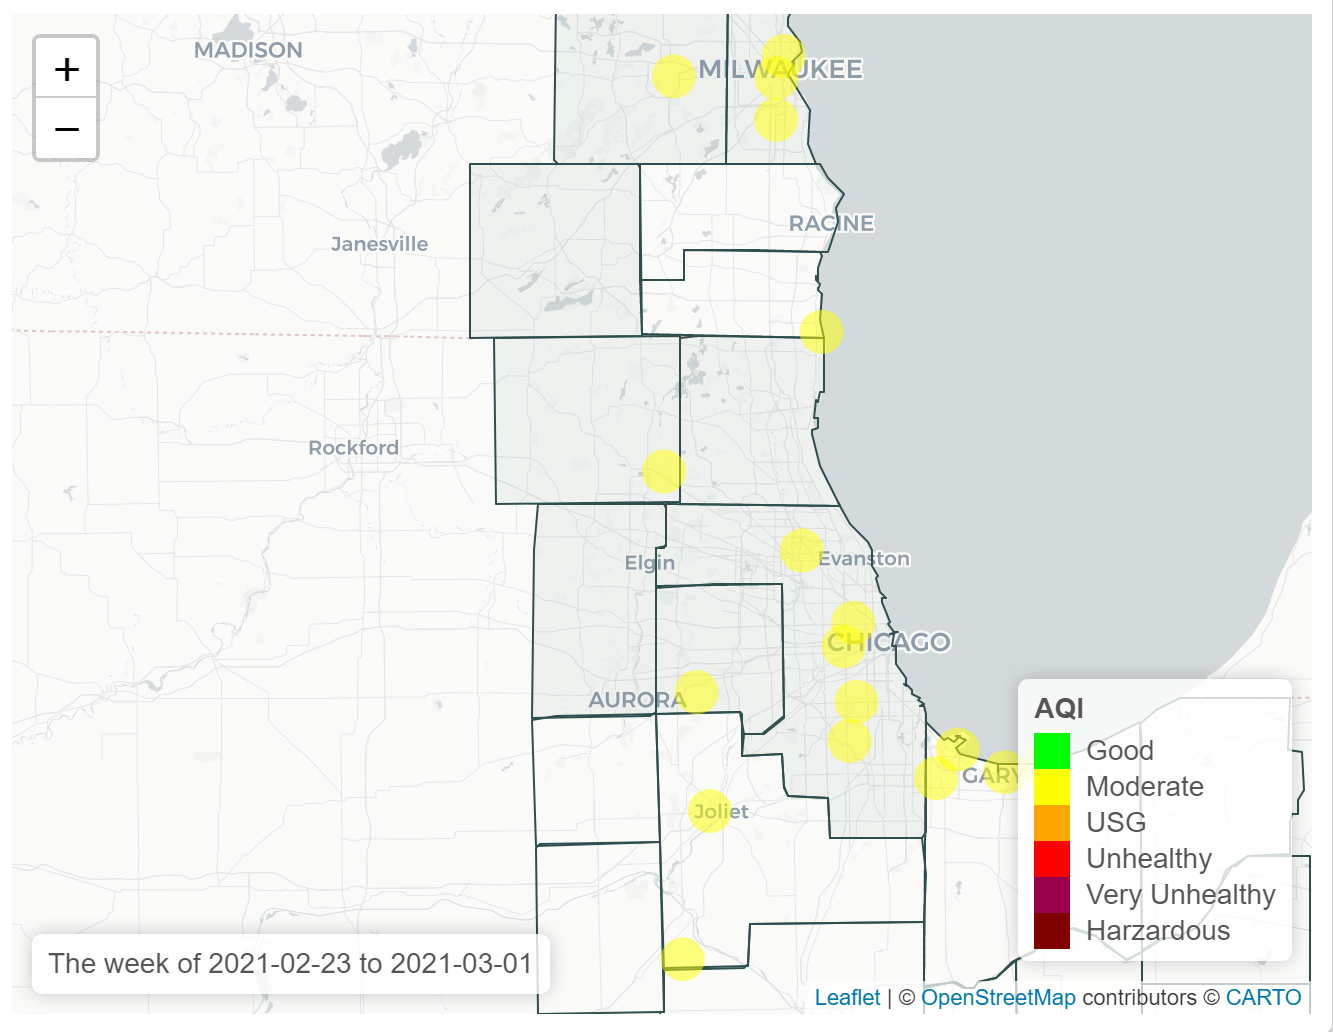
- Weekly update of PM 2.5 and AQI sensors throughout Chicagoland area (visualized as graduated color map)
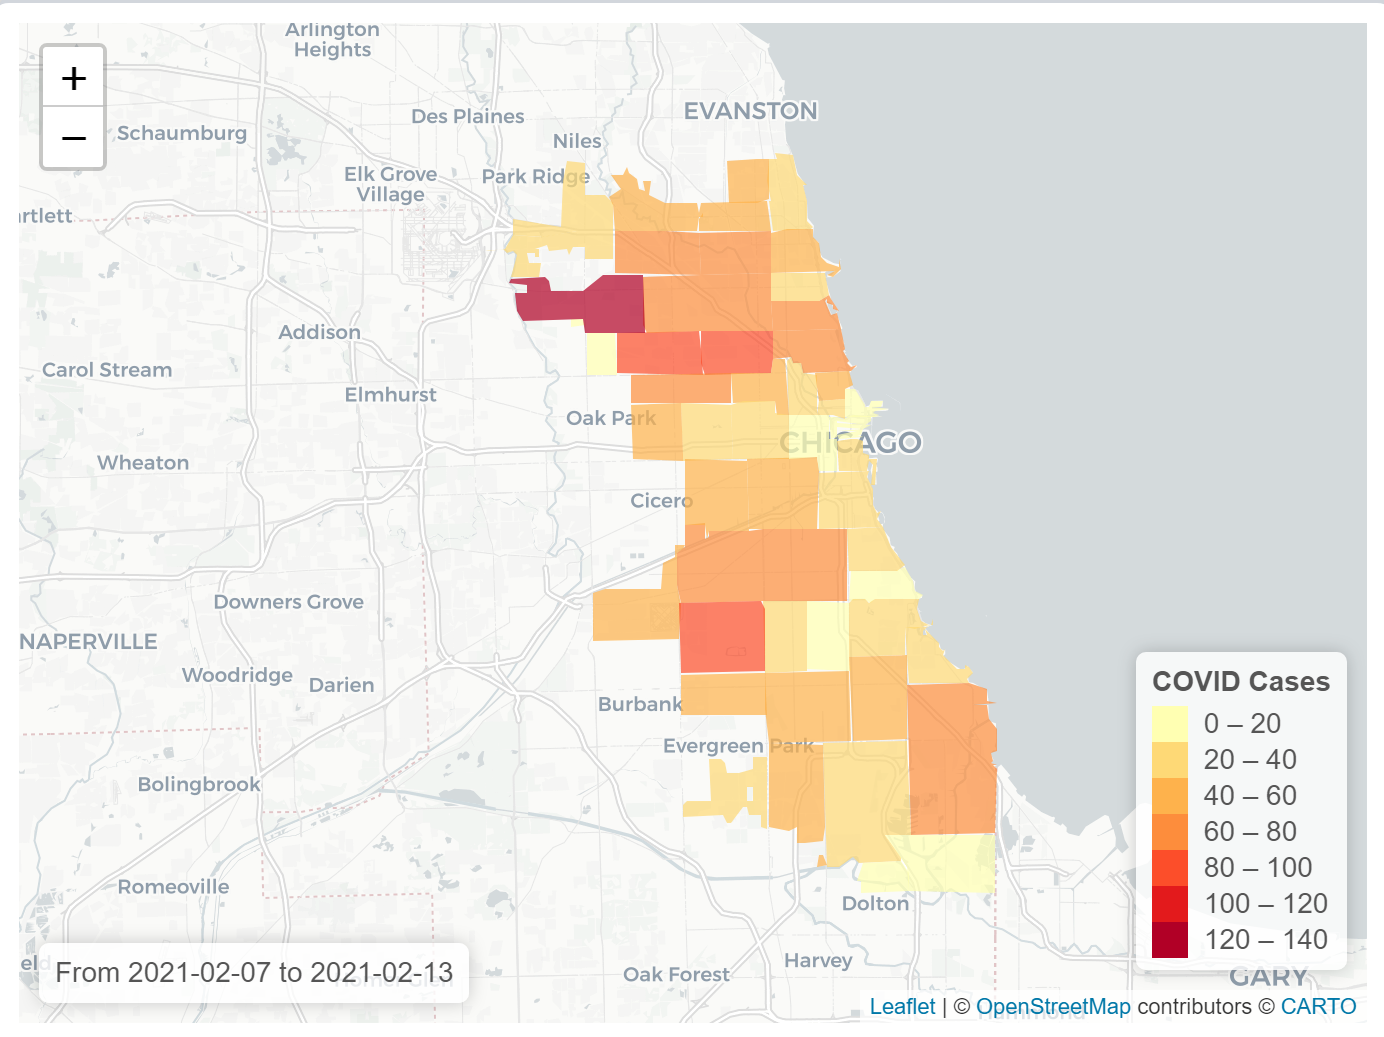
- Weekly update of 7-day new confirmed cases for COVID (ex) by zip code in Chicago
- Historical weekly average for PM2.5 by 1km^2 grid cell for Chicagoland region (using 5-year model average), for that week
- Social Vulnerability Index (5-year average) by tract? in Chicago
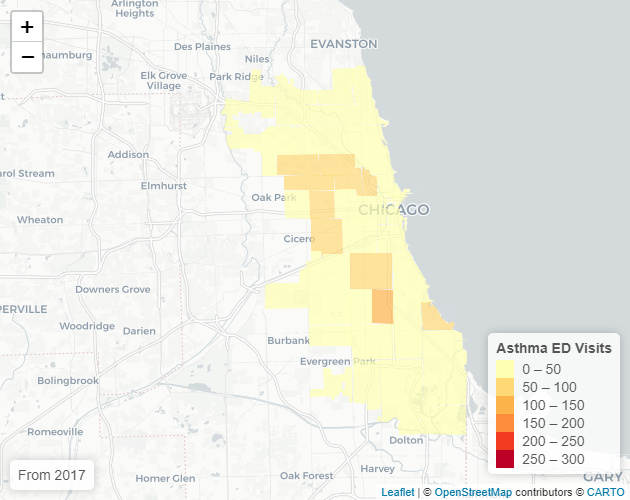
- Asthma Visits (using Chicago Health Atlas) by zip code in Chicago


Dashborad Prototype was created using the data files in data folder and function. Detailed description of the data files and how the maps are created can be found in the Data folder.
- Map 2 variables side by side, or select 1 map at a time? or use tab for each map?
- What's the spatial scale?
- Best method of weekly pull for PM2.5 and COVID that's low tech enough for City, as integrated to R-Shiny App
- Security for ShinyApp; pwd protected on AWS server, vs teach City how to install on their local machines