Web-Design-Challenge
Latitude - Latitude Analysis Dashboard with Attitude
In this project, a visualization dashboard website has been created using visualizations related to weather data. In building this dashboard, there are individual pages for each plot and a navigation between them. These pages contain the visualizations and their corresponding explanations. There is a landing page, a page for a comparison of all of the plots, and another page to view the data used to build them.
-
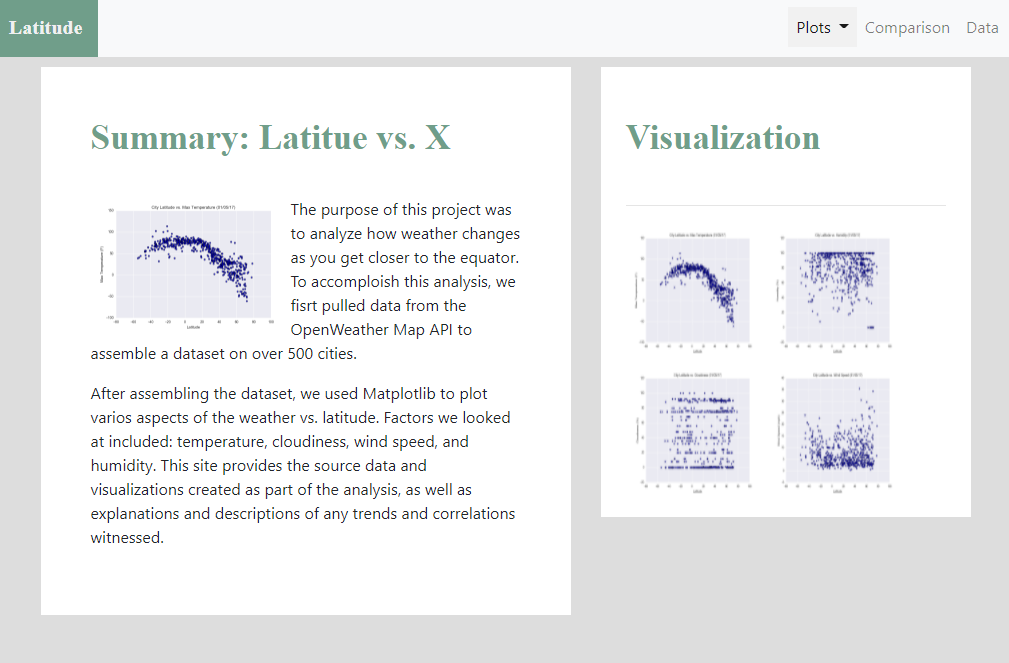
Landing page containing:
- An explanation of the project.
- Links to each visualizations page. There should be a sidebar containing preview images of each plot, and clicking an image should take the user to that visualization.
-
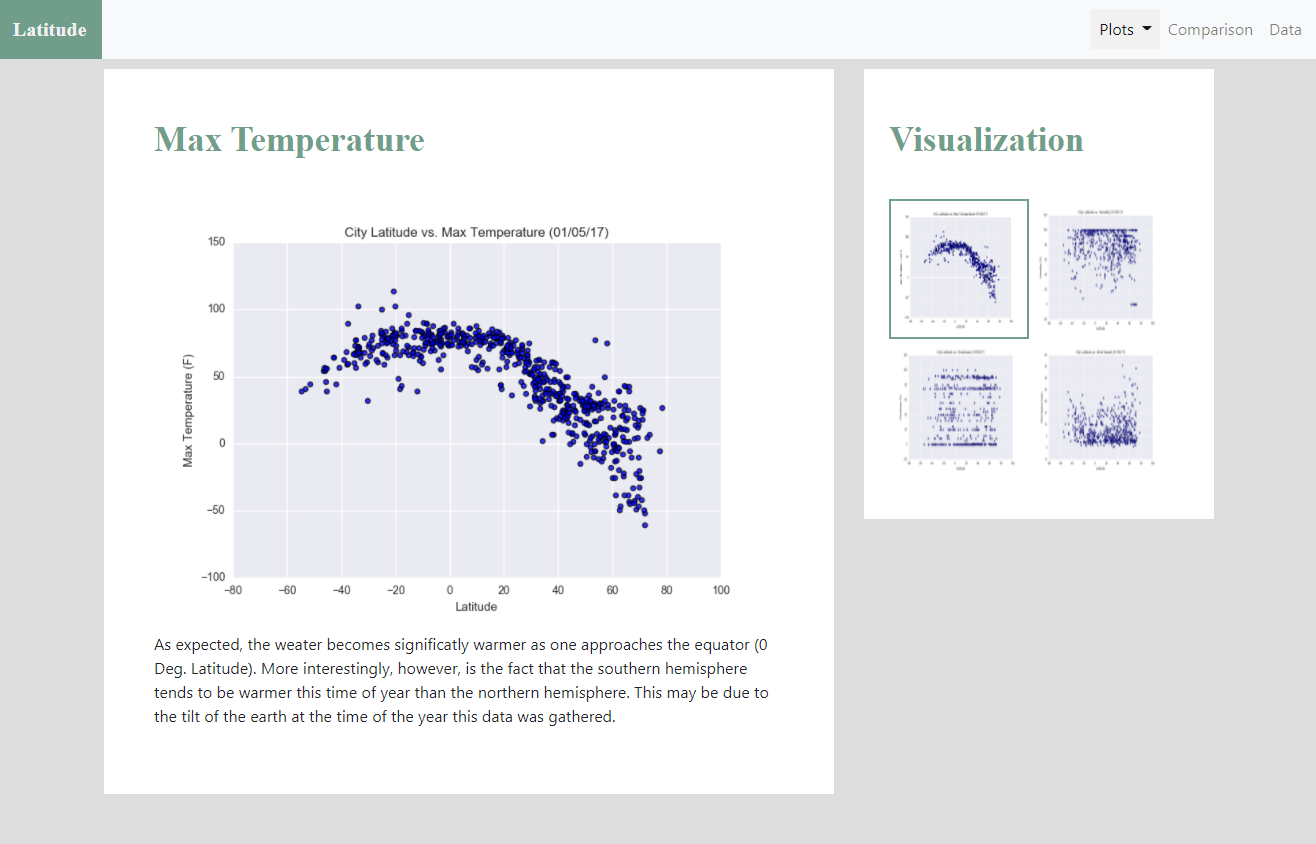
Visualization pages, each with:
- A descriptive title and heading tag.
- The plot/visualization itself for the selected comparison.
- A paragraph describing the plot and its significance.
-
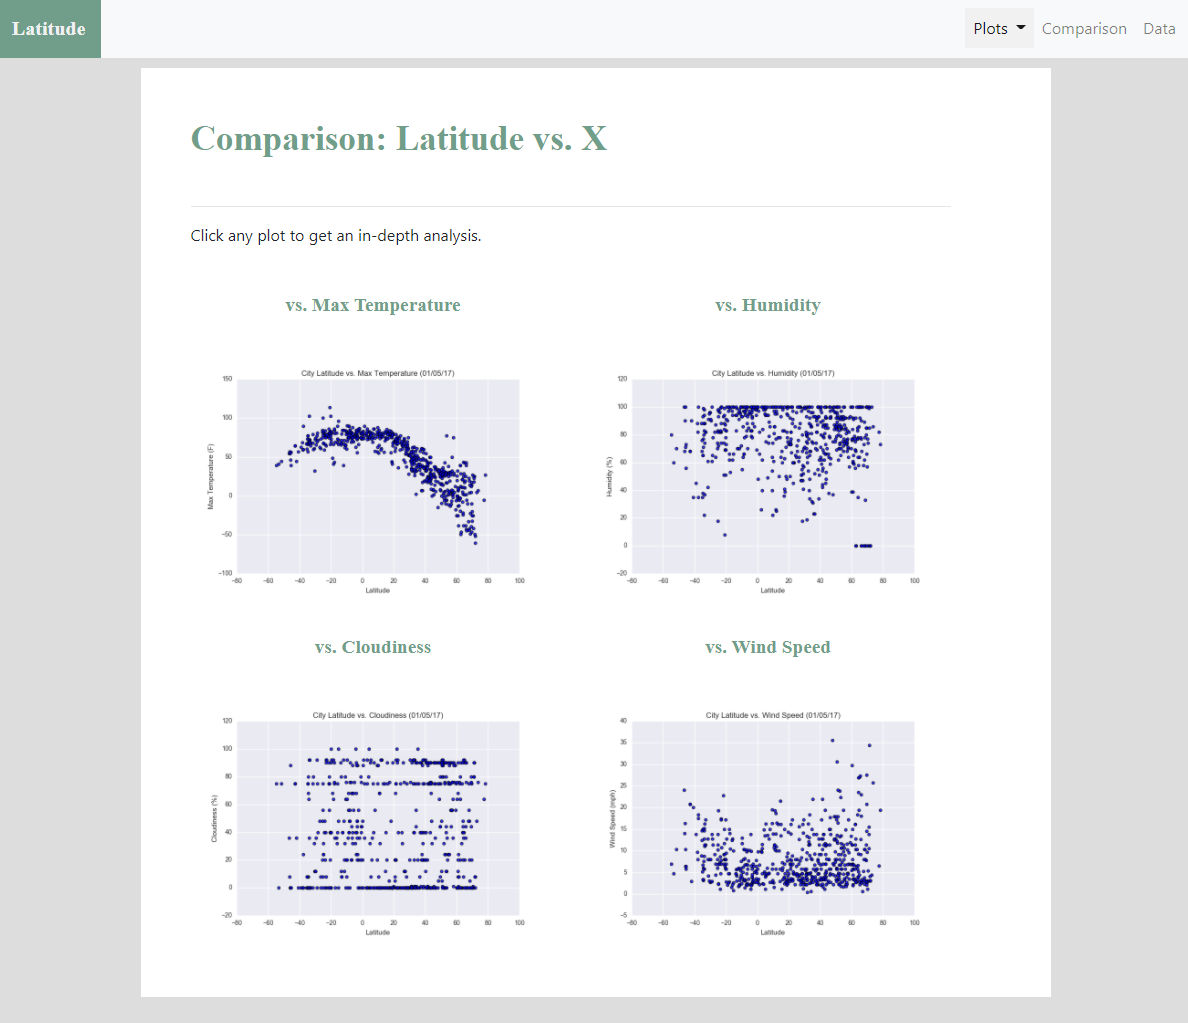
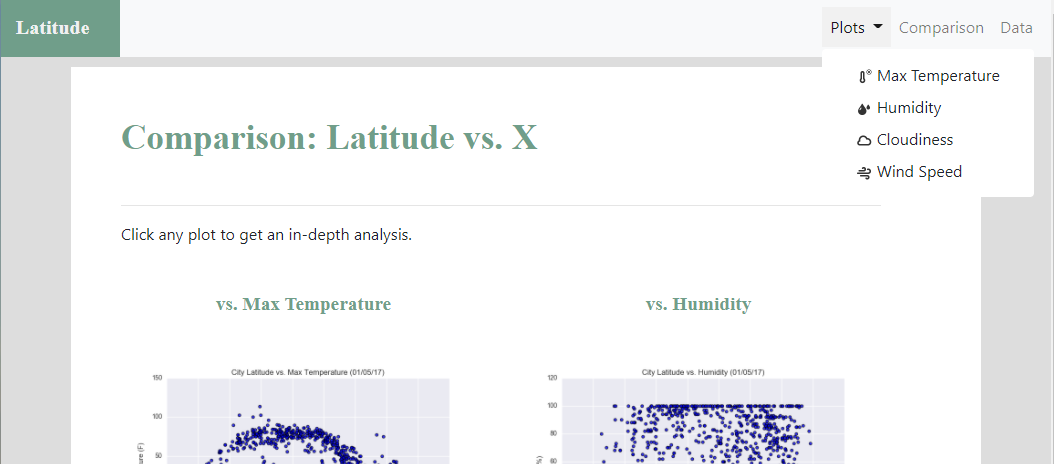
Comparisons page:
- Contains all of the visualizations on the same page so we can easily visually compare them.
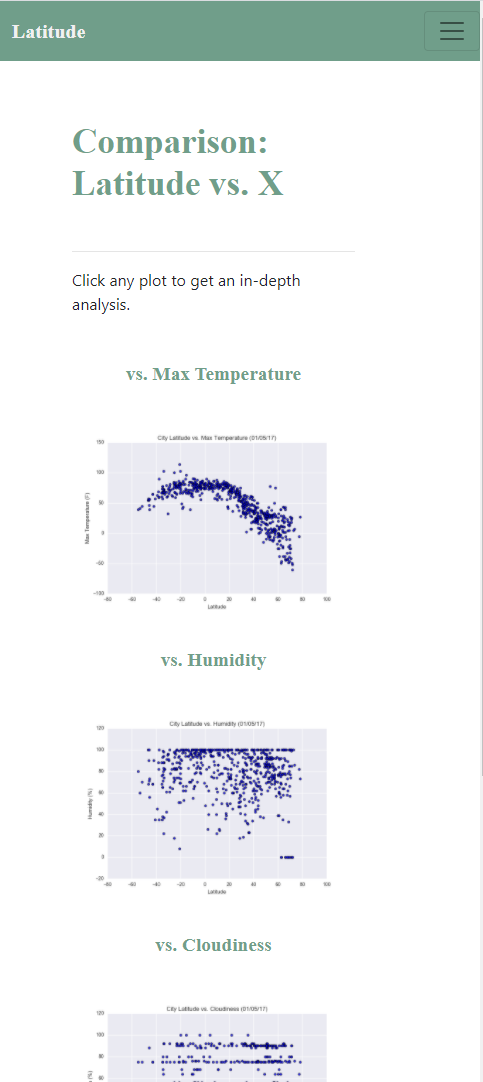
- Uses a Bootstrap grid for the visualizations. The grid is two visualizations across on screens medium and larger, and 1 across on extra-small and small screens.
-
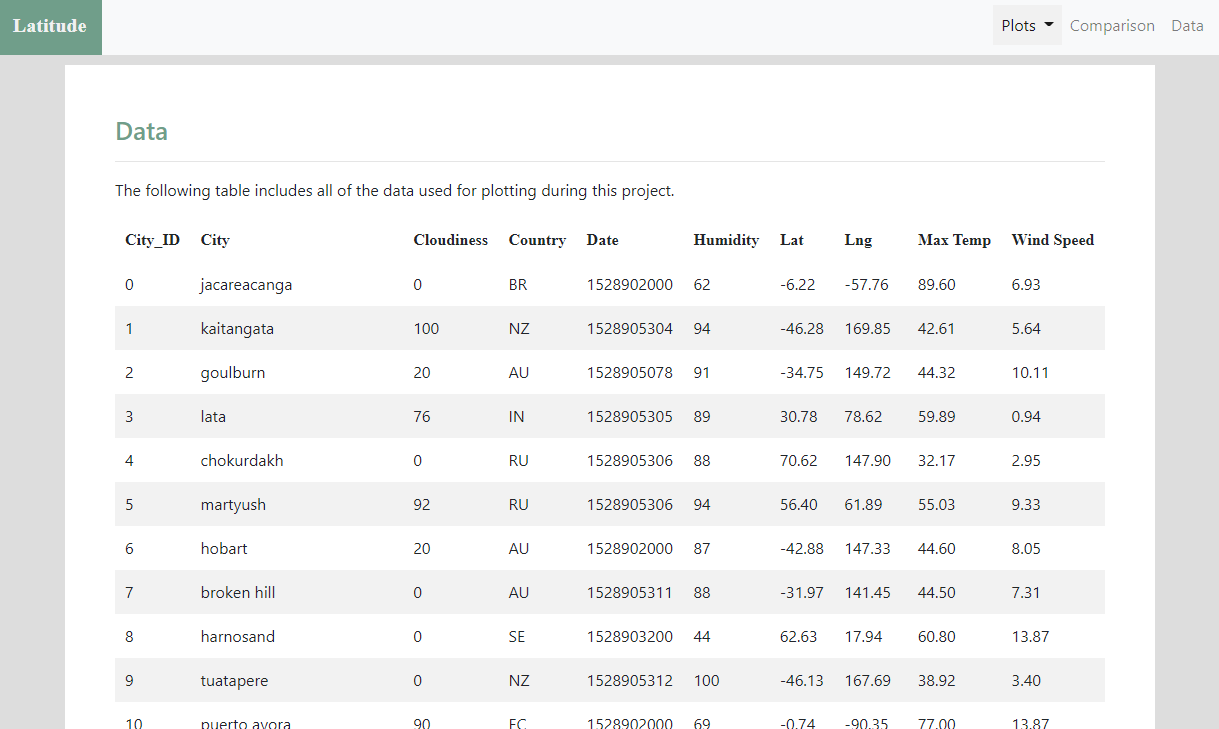
Data page:
- Displays a responsive table containing the data used in the visualizations.
- The table is a bootstrap table component.
- The data come from converting cities.csv file to HTML. I used pandas in jupyter noptebook to achive this. It generates a HTML table from a pandas dataframe and saving it into table.html. Then table.html has been imported into data.html.
-
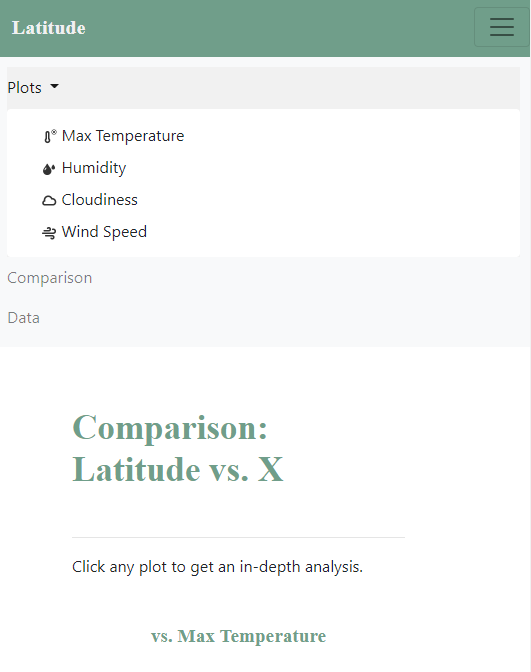
There is a a navigation menu used at the top of every page. it has been saved into header.html and then it has been imported into all pages in the website. This navigation menu:
- Has the name of the site on the left of the nav which allows users to return to the landing page from any page.
- Contains a dropdown menu on the right of the navbar named "Plots" that provides a link to each individual visualization page.
- Provides two more text links on the right: "Comparisons," which links to the comparisons page, and "Data," which links to the data page.
- Is responsive (using media queries). The nav must have similar behavior as the screenshots "Navigation Menu" section (notice the background color change).
- Includes a few glyphicons used next to links in the header.


Finally, the website is deployed to GitHub pages.