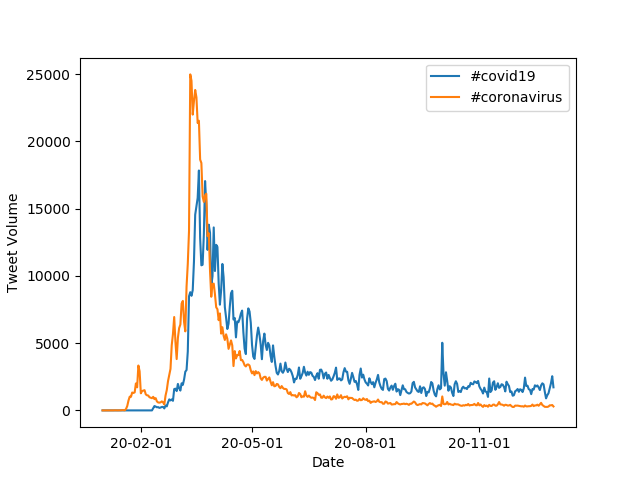
For this project, I used the mapreduce method and the matplotlib library to generate graphs illustrating the use of various hashtags related to the coronavirus for the year 2020.
The map.py file processes a zip file for an individual day of tweets and tracks the usage of the hashtags on both a language and country level. For example, the command
$ python3 ./src/map.py --input_path=/data/Twitter\ dataset/geoTwitter20-02-16.zip
creates a folder called outputs that contains a file /geoTwitter20-02-16.zip.lang, which contains JSON formatted information summarizing the tweets from 16 February.
The run_maps.sh file loops over each file in the dataset and runs the map.py command on that file.
For example, the command
$ nohup sh run_maps.sh &
will run maps.py for all of the zip files for all the days in 2020.
The reduce.py file merges the outputs generated by the map.py file so that the combined files can be visualized. For example, the command
$ python3 ./src/reduce.py --input_paths outputs/geoTwitter20-*.lang --output_path=reduced.lang
generates a file called reduced.lang that contains data for all of hashtag usage by language for all of 2020. Additionally, the command
$ python3 ./src/reduce.py --input_paths outputs/geoTwitter20-*.country --output_path=reduced.country
generates a file called reduced.country that contains data for all of hashtag usage by country for all of 2020.
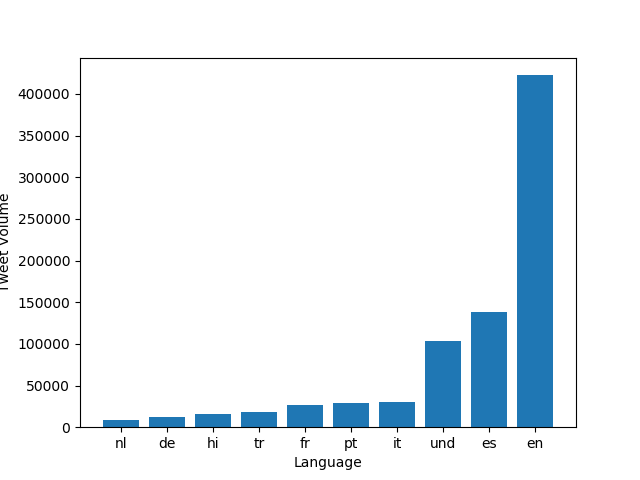
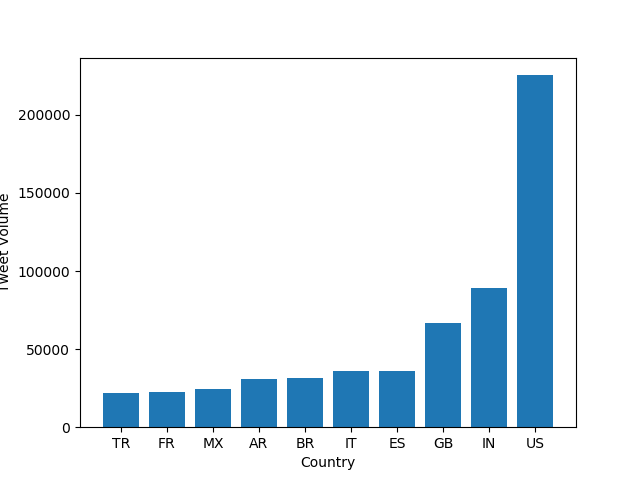
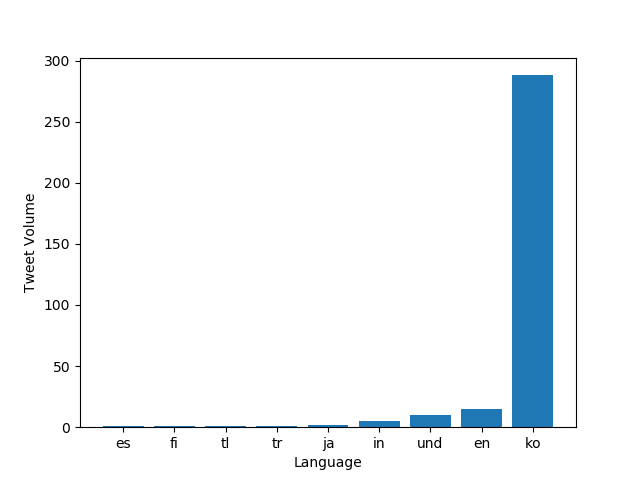
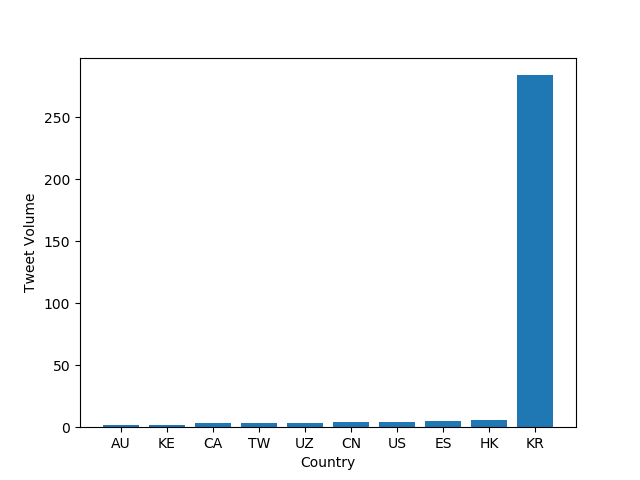
The visualize.py file takes --input_path and --key as inputs and generates a bar graph of the the top 10 languages/countries (depending on the --input_path) that used the hashtag specified by --key and stores the bar graph as a png file. For example, by running the command
python3 ./src/visualize.py --input_path=reduced.lang --key='#coronavirus'
We get
By running the command
python3 ./src/visualize.py --input_path=reduced.country --key='#coronavirus'
We get
By running the command
python3 ./src/visualize.py --input_path=reduced.lang --key='#코로나바이러스'
We get
By running the command
python3 ./src/visualize.py --input_path=reduced.country --key='#코로나바이러스'
We get
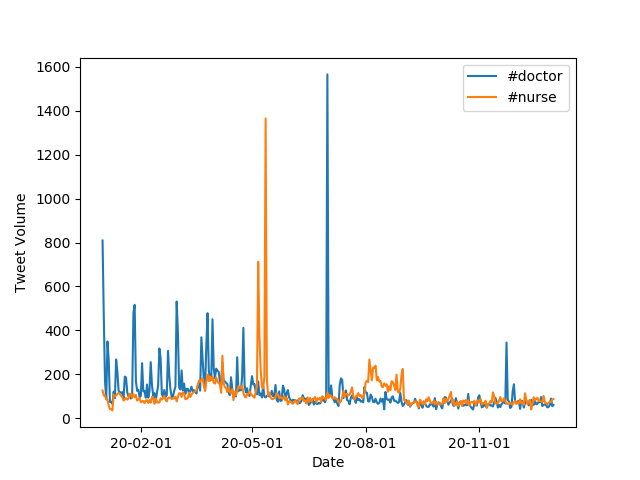
The alternative_reduce.py file takes several --keys as inputs and outputs a line graph of the use of each key (in tweet volume) throughout the year.
By running the command
python3 ./src/alternative_reduce.py --keys '#doctor' '#nurse'
We get
python3 ./src/alternative_reduce.py --keys '#doctor' '#nurse'
We get
