fping-exporter allows you to run measure network latency using fping and prometheus. Compared to blackbox-exporter, it gives you additionally latency distribution and a packet loss statistics. Also, it is probably better performing thanks to fping.
WARNING: This is currently a work in progress, the code is not production-ready yet
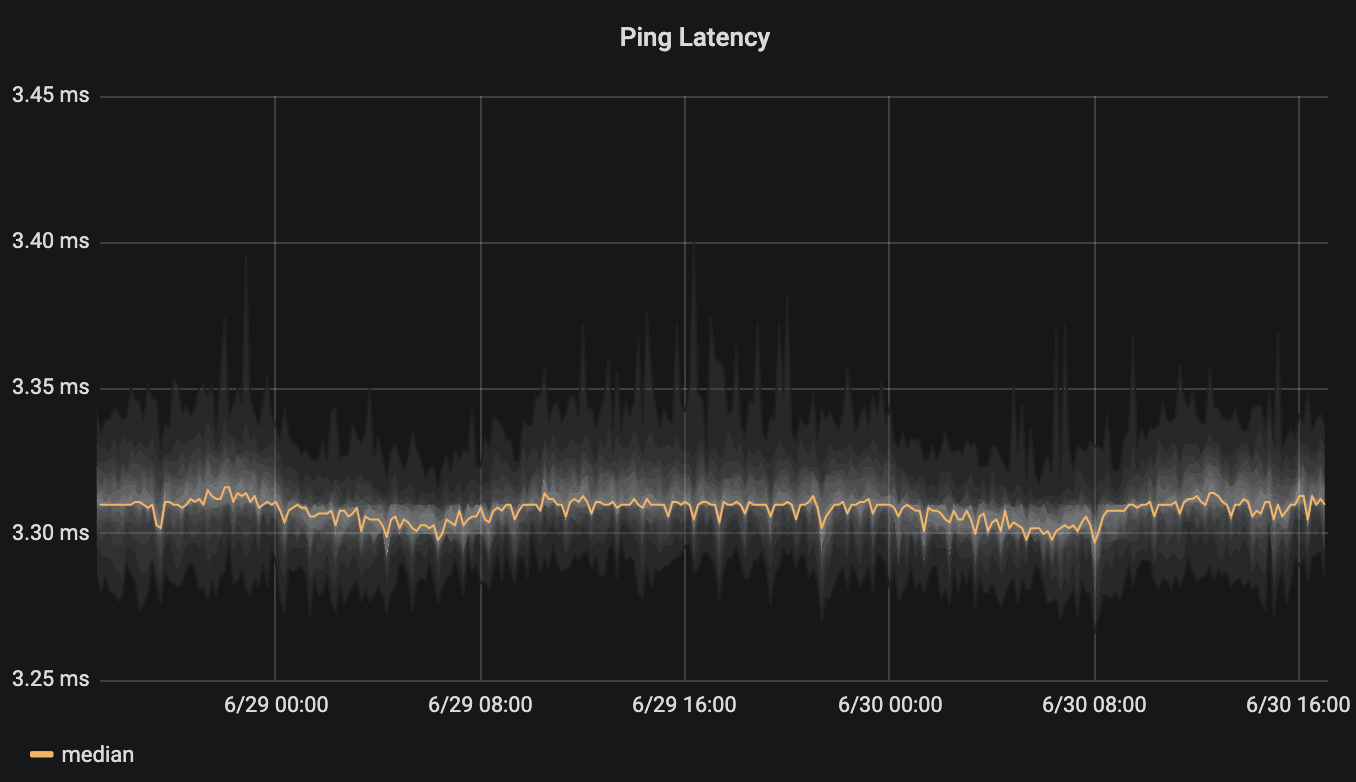
This graph shows the fping_rtt summary as "SmokePing"-like graph in Grafana:

- Start fping-exporter as follows:
fping-exporter [OPTIONS] Application Options: -l, --listen=[HOST]:PORT Listen address (default: :9605) -p, --period=SECS Period in seconds, should match Prometheus scrape interval (default: 60) -f, --fping=PATH Fping binary path (default: /usr/bin/fping) -c, --count=N Number of pings to send at each period (default: 20) Help Options: -h, --help Show this help message - Configure Prometheus to use this, as you would with blackbox-exporter. For example:
global:
  scrape_interval: 60s

scrape_configs:
  - job_name: test
    metrics_path: /probe
    static_configs:
    - targets:
      - "8.8.4.4"
      - "8.8.8.8"
    relabel_configs:
    - source_labels: [__address__]
      target_label: __param_target
    - source_labels: [__param_target]
      target_label: instance
    - target_label: __address__
      replacement: 127.0.0.1:9605  # The fping-exporter's real hostname:port.
fping-exporter produces the following metrics:
fping_sent_count: Number of sent probesfping_lost_count: Number of lost probesfping_rtt_count: Number of measured latencies (successful probes)fping_rtt_sum: Sum of measured latenciesfping_rtt: Summary of measured latencies