Python software for k-means clustering of partially observed data from Chi, Chi, and Baraniuk (2016) <doi:10.1080/00031305.2015.1086685>.
The k-POD method presents a simple extension of k-means clustering for missing data that works even when the missingness mechanism is unknown, when external information is unavailable, and when there is significant missingness in the data. In addition, k-POD presents strong advantages in computation time and resources over other methods for removing missingness, while still maintaining accuracy.
Citation information is provided near the bottom of this README file.
These instructions will walk you through the process of installing and using the k-POD package in your local environment.
First, ensure that you have the package manager pip installed for your Python version. You can find the installation instructions at this link.
In order to use k-POD, you should have Pandas, NumPy, and SciPy. Installation instructions can be found in the links shown or below in the examples.
# install Pandas
pip install pandas

# install NumPy
pip install numpy

# install SciPy
pip install scipy
The k-POD Python package was designed simplistically and the installation can be accomplished in only one step, assuming the dependencies mentioned above are installed.
Use the package manager pip (installation instructions above) to install the k-POD package.
pip install kpod
You should now have k-POD installed locally on your device.
The Usage section below demonstrates the features of k-POD for clustering. The Examples section goes in more depth on all of the available functions with built-in examples.
With a given dataset containing some missing values, you will use the steps below to perform the k-POD clustering algorithm.
# import the k_pod method
from kPOD import k_pod

# set the number of clusters desired (in this example, 3)
K = 3

# use previously existing data to perform clustering
clustering_results = k_pod(data_set, K)

# k_pod outputs a tuple with the cluster assignments and centers
print(clustering_results)

Output:
(cluster_assignments, cluster_centers)

# save the cluster assignments and centers
cluster_assignments = clustering_results[0]
cluster_centers = clustering_results[1]
First, we generate a dataset with missing values using the utility functions available in the k-POD package.
# import function to generate data
from kPOD import generate_complete_data

# number of observations for the data
N = 10
# number of features/dimensions for the data
P = 2
# number of clusters the data should have
K = 3
# distance between each cluster
CLUSTER_DISTANCE = 5

# use function to generate data set
data_set = generate_complete_data(N, P, K, CLUSTER_DISTANCE)

# view generated data set
>>> data_set
[[-0.53044271 -2.23450779]
 [-1.0860111   1.59151924]
 [ 0.16173119  0.65364989]
 [ 3.44575031  6.93929861]
 [ 5.54232482  4.49887709]
 [ 4.43165189  4.42414154]
 [12.47158915  9.83366756]
 [13.09792485  9.02237441]
 [ 9.07237922  8.43085377]
 [13.94656989 15.6348249 ]]
Next, we generate randomized indices where the numerical values should be replaced with NaN.
# import function to generate indices
from kPOD import generate_missing_indices

# shape of the data set generated in the last step
SHAPE = (N, P)
# percentage of the data set that should have missing values
MISSING_PERCENT = 10

# use function to generate data set
missing_indices = generate_missing_indices(SHAPE, MISSING_PERCENT)

# view generated data set
>>> missing_indices
[(1, 1), (6, 0)]
Then, we use the fill_missing_indices function to fill the data set with the generated missing indices.
# import function to fill data set with missing values
from kPOD import fill_missing_indices

# use function to fill data set
data_missing = fill_missing_indices(data_set, missing_indices)

# view data set with missing values
>>> data_missing
[[-0.53044271 -2.23450779]
 [-1.0860111          nan]
 [ 0.16173119  0.65364989]
 [ 3.44575031  6.93929861]
 [ 5.54232482  4.49887709]
 [ 4.43165189  4.42414154]
 [        nan  9.83366756]
 [13.09792485  9.02237441]
 [ 9.07237922  8.43085377]
 [13.94656989 15.6348249 ]]
Now, we can use the k-POD algorithm to cluster the data set containing missing values.
# import the k_pod method
from kPOD import k_pod

# set the number of clusters to 3
K = 3

# use data with missing values to perform clustering
clustered_data = k_pod(data_missing, K)

# save the cluster assignments and centers
cluster_assignments = clustered_data[0]
cluster_centers = clustered_data[1]

# view cluster assignments
>>> cluster_assignments
[0. 0. 0. 2. 2. 2. 2. 1. 2. 1.]

# view cluster centers
>>> cluster_centers
[array([-0.48490754, -0.05269574]), array([13.52224737, 12.32859965]), array([5.63207229, 6.82536771])]
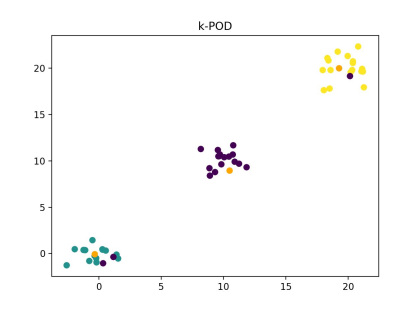
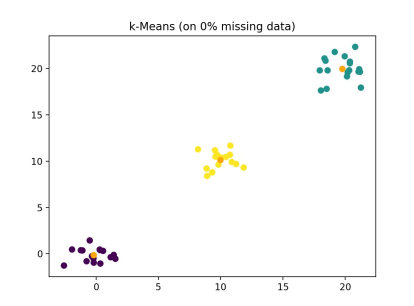
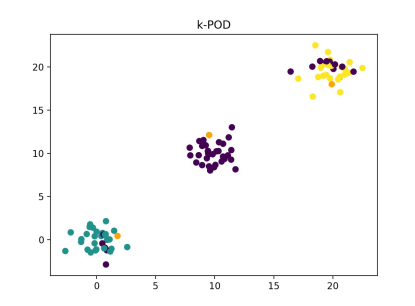
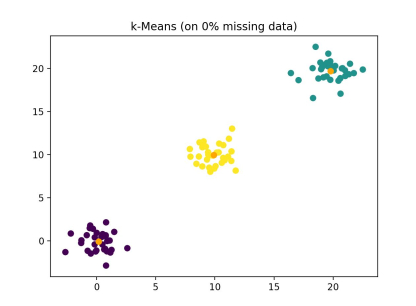
Finally, we can plot the results of the k-POD algorithm. In these examples, the shape of the data set is defined by (N, P), the number of clusters by K, and the percentage of the data that was missing is mentioned. The comparison shown is the k-POD algorithm with the data containing missing values inputted, while the k-means algorithm was given the complete data set (k-Means does not work on data sets with missing values).
Note: Colors are randomly assigned for each image and they do not indicate the same clusters of data across images.
As shown, the k-POD algorithm shows only small decreases in accuracy over k-means while accomplishing a clustering task that would be otherwise computationally expensive with missing data. In addition, the k-means algorithm shown above is used on the complete data set, since k-means does not work on data sets with missing values.
If you find that this Python implementation of k-POD has contributed to your published work, please include the following citations:
Chi JT, Chi EC, Baraniuk RG (2016). “$k$-POD: A Method for
Corresponding BibTeX entry:
  @article{,
    title = {$k$-POD: A Method for $k$-Means Clustering of Missing Data},
    author = {Jocelyn T. Chi and Eric C. Chi and Richard G. Baraniuk},
    journal = {The American Statistician},
    year = {2016},
    volume = {70},
    pages = {91--99},
    doi = {10.1080/00031305.2015.1086685},
    issue = {1},
    url = {http://www.tandfonline.com/doi/abs/10.1080/00031305.2015.1086685},
  }
Radia, Ishaan (2020). “A Python implementation of k-POD.” https://github.com/iiradia/kPOD/.
Corresponding BibTeX entry:
  @misc{,
    author = {Ishaan Radia},
    title = {A Python implementation of {$k$-POD}},
    url = {https://github.com/iiradia/kPOD/},
    month = {June},
    year = {2020}
  }
-
Ishaan Radia - Rising Junior majoring in Statistics at North Carolina State University - Translated paper to Python package, responsible for maintenance of package. - LinkedIn - GitHub
-
Jocelyn T. Chi - PhD Student in Statistics at North Carolina State University - Co-Author of $k$-POD paper and algorithm. - Website
-
Eric C. Chi - Assistant Professor of Statistics at North Carolina State University - Co-Author of $k$-POD paper and algorithm, Faculty mentor for this Python implementation of $k$-POD - Website
-
Richard G. Baraniuk - Victor E. Cameron Chair of Electrical and Computer Engineering at Rice University - Co-Author of $k$-POD paper and algorithm. - Website
This project is licensed under the MIT License. You can find more details in the LICENSE.md file.


