A Linux Kernel Execution Flow Research Tool for Upcomming Kernel Hackers (and Veterans)
You are new to Linux kernel development and want to develop a driver, contribute new network stack functionality, better understand the complex process scheduler or just chase a kernel bug - then the Kernel Magnifier could provide some support.
Many developers new to the Linux kernel development find it difficult to understand the kernel. The kernel is a beast of its own. It is not simple code, on the contrary: even if you have mastered programming languages such as C/C++ with a black belt, it is incredibly tedious to understand the kernel. This is due to the following reasons, among others
- The Linux kernel has its very own runtime, which is completely different from userspace. There are many execution contexts which are complex even for experienced kernel developers
- Many things are processed asynchronously! Top and bottom halves from the Informatics lecture are still familiar to many. But the kernel is much more complex here. There are softwirqs, workers, tasklets and other context and subsystem add custom implementations - like NAPI for the network stack (imagine this as an on-demand bulk processing mechanism) - on top of it. None of this makes the kernel any simpler.
- The kernel is highly optimized, often every instruction in the processing hot path is optimized to elicit the last percent of performance
- Many indirect functions via function pointers are included in the kernel, e.g. fileops structure.
- The kernel has grown over decades - technical debts have also accumulated here, which do not make the whole thing any easier
The Kernel Magnifier helps by recording the complete$ function call chain of executed kernel functions (ftrace) and then allow to visualize these in an graph form. The graph form provides a relatively clear representation of caller/calllee and call chains. It also shows which functions are called frequently and which are called less frequently. This information is useful for gaining an overview (hot path, slow path).
$: Becuase of the high frequency tracing an overflow can occur and is not rare. Furthermore there are a lot of functions which are inlined in the build process of the Linux kernel, also these functions are not traceable. And last but not least: some functions of the ftrace subsystem are also not traceable for recursive reasons.
Without arguments, ftrace-callgrapher will by default capture trace data on all CPUs for 10 seconds:
$ sudo kernel-magnifier.py record
Record mode - now starting recording traces for 10.0 seconds
Wrote data to kernel-magnifier.data
Record filesize: 657.75 MiB
This will generate huge amount of data, even for the later post processing. Additionally, it burdens the CPU cores and you risk data loss. If data can be filtered in the recoring phase: perfect. Two options allow filtering for now: the recorded time and a filter on what CPUs recording should be done. The later is really important especially on 16+ multi-core systems.
$ sudo kernel-magnifier.py record --record-time 10 --cpumask 1
Record mode - now starting recording traces for 10.0 seconds
Limit recording to CPU mask 1
Wrote data to kernel-magnifier.data
Recorded filesize: 199.38 MiB
Visualization is quite ease, just call with visualize as an argument:
$ kernel-magnifier.py visualize
Visualization mode - now generating visualization...
parsing completed, found 2316184 events
function-calls.png generated
kernel-magnifier.pdf generated
The previous illustration show a full graph, of all callchains recording within 10 seconds of kernel high live an rather idle system.
The kernel magnifier becomes particularly useful if you limit the visualization to the relevant functions.
For symbol path filtering a mapping table function name to filename must be generated.
This map file contains a pure line based mapping between kernel function name
and source code line within the Linux kernel source tree. For this you need a
tool named dwarfdump as well as debug package of the kernel, see Installation
notes.
$ kernel-magnifier.py generate-symbol-map -k /usr/lib/debug/boot/vmlinux-$(uname -r)
Now filter just for network related files, filtering for drivers/net/,
net/ and some other files named somehow net.
$ kernel-magnifier.py visualize --filter-filepath net
Visualization mode - now generating visualization...
parsing completed, found 2316184 events
function-calls.png generated
kernel-magnifier.pdf generated
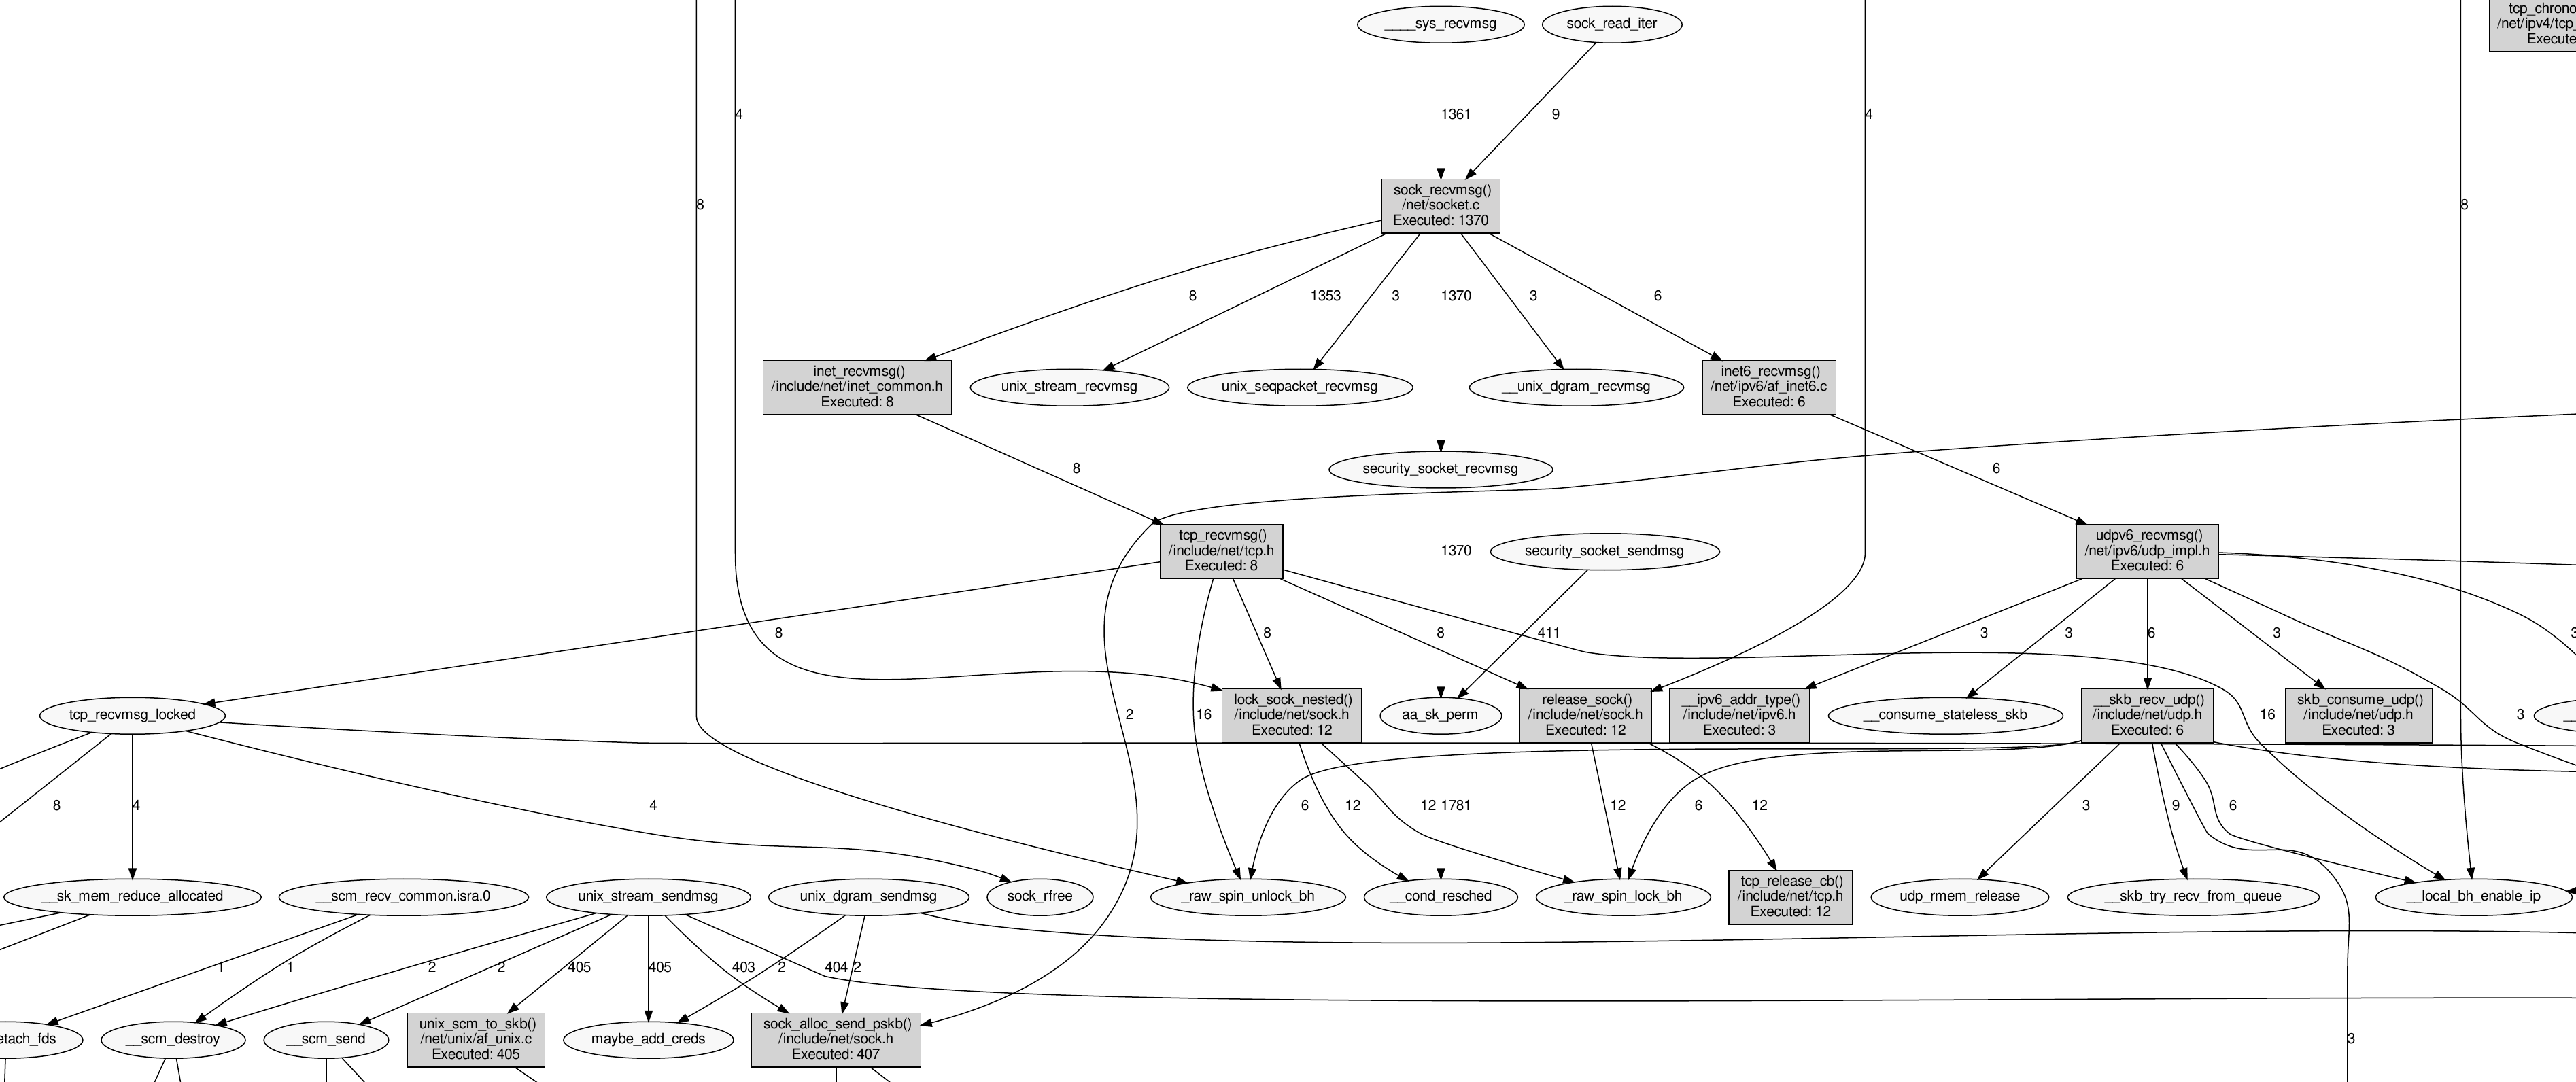
Now the graph is limited to network related functions and become really useful. You can start zooming with you PDF viewer and looking at interesting aspects.
The following picture shows the right section enlarged. These are routines for
incoming packet processing via recvmsg()
Another use case is to analyze the Linux Process/Task scheduler, this can be accomplished via
$ kernel-magnifier.py visualize --filter-filepath kernel/sched/fair.c,/kernel/sched/sched.h
The illustration show one third of all scheduler related function. What is also visible in the image: functions called often a more highlighted in red. The "reddisher", the hotter the function.
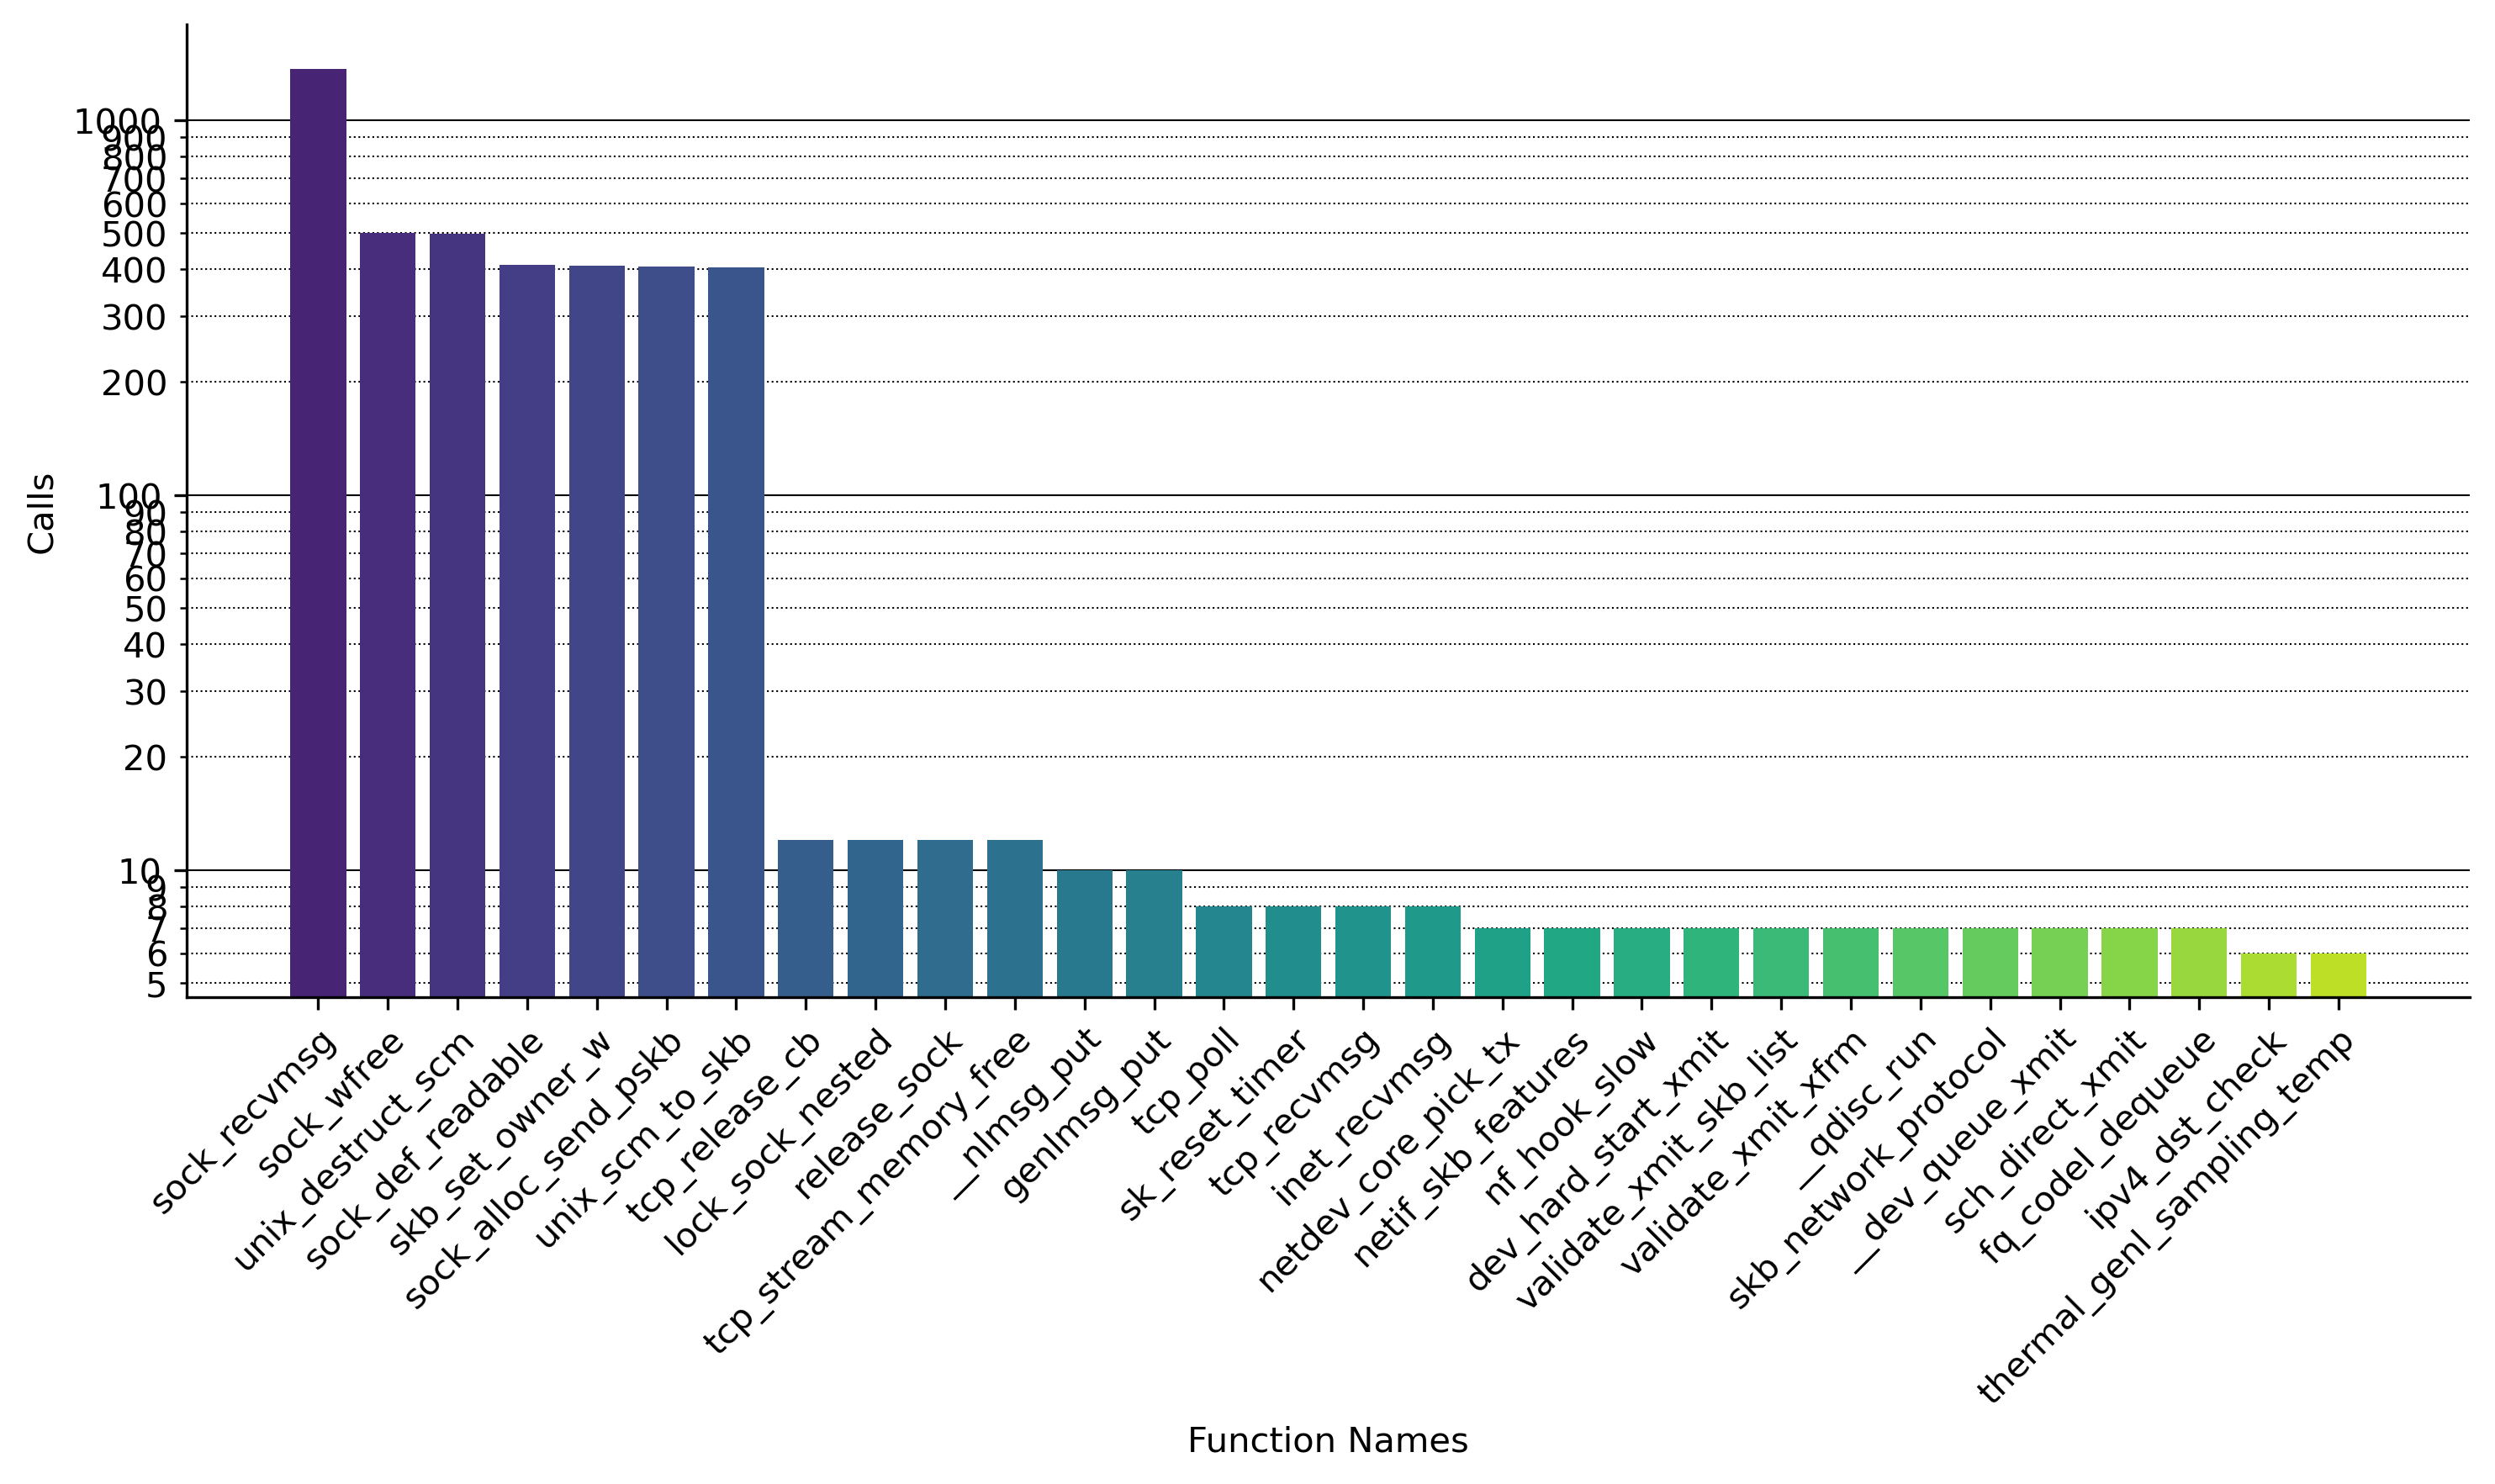
Because the function call is just available, the visualizer always plot the list of called functions, sorted by highest. Here for the net use case
Just clone/download the repository and execute the main script: https://github.com/hgn/kernel-magnifier.git
The script requires python3-pygraphviz, python3-matplotlib and python3-numpy.
kernel-magnifier requires optionally debug symbols to map symbols to source code files. For the actual mapping we use the dwarf information, to get the data the tool use dwarfdump, so just install the packages.
For Debian Trixie:
# Mandatory
$ apt-get install python3-pygraphviz python3-matplotlib python3-numpy

# Optional, for symbol filtering required
$ apt-get install dwarfdump
$ apt-get install linux-image-amd64-dbg
NOTE: linux-image-amd64-dbg will consume roughly 600MiB of harddisk


