LivePlot
Idea
What LivePlot does is actually pretty simple: It allows you to send pairs of numbers associated with a string
(think of a category or quantity) to be plotted and collected somewhere else. That somewhere else can be on the
very same machine, or literally somewhere else reachable over a network connection, e.g., an edge device. It should
be as lightweight, easy to integrate, and unobtrusive as possible ... and ideally easy to disable if desired in
case it only serves to gather information needed for debugging purposes during development. Think of simulations, or
any kind of data collection application.
Implementation
To really keep things simple, we don't require anything like an MQTT broker running. Instead, we rely on the
pub/sub mechanism of ZeroMQ. LivePlot consists of the following parts:
- a C++ library liveplot that can be linked to an application to produce data to plot (
see example)
- additionally, there is another C++ library,
liveplot-noop, that simply consists of empy functions and can therefore be replaced with theliveplotlibrary to completely disable any sending, i.e., plotting of data, at any time - a Python module
pyliveplot(see example how to use it in a script)
- additionally, there is another C++ library,
- a C++ library liveplot-sub with a plain C interface to subscribe to pairs of data
- a GUI application (made with the awesome TAURI framework), able to connect to such data
producers and plot it. It also allows to save plots as images, and collected data to CSV file for further processing.
Again, simplicity here is key. This makes use of the C library of
liveplot-sub, and also demonstrate how to subscribe from Rust code (cf. main.rs).
Build
See compilation instructions for details how to build this project.
Example
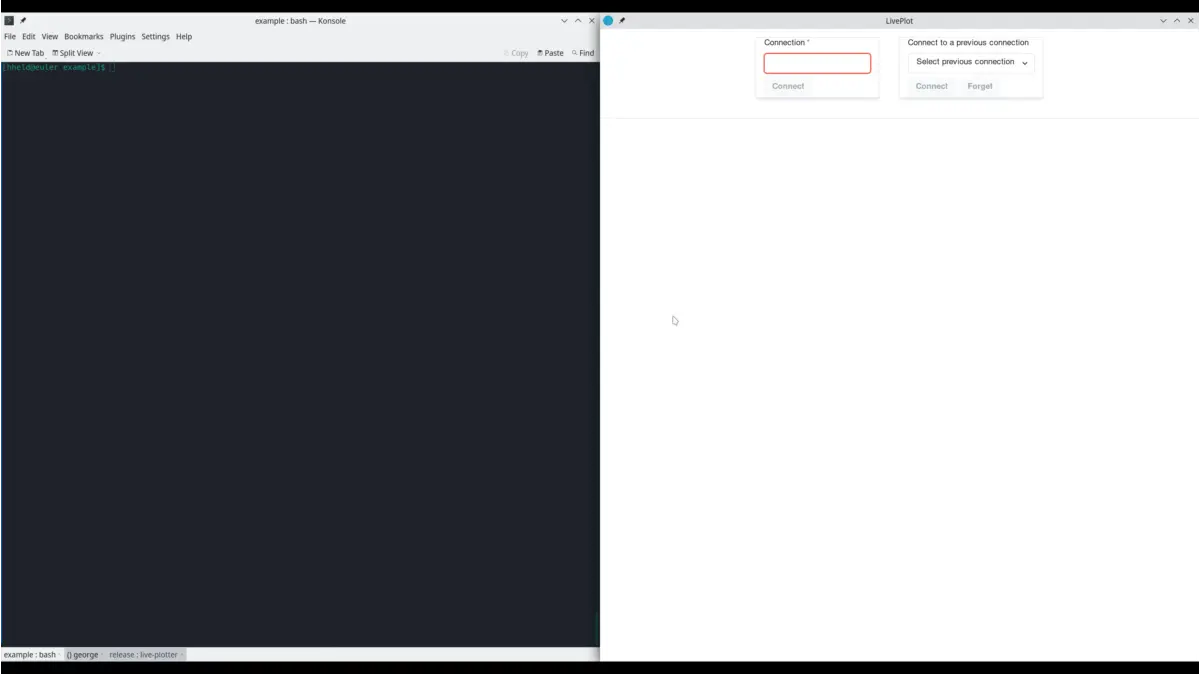
The following video shows how the C++ example runs first locally, then on a remote
machine, and the live-plotter application connects via IPC and TCP, respectively, to plot the produced sample data.
In examples, you find two Python scripts that show the usage of the Python binding in comparison to
matplotlib.animation. That particular example produces data
in 1ms intervals for 1s; rendering as matplotlib real time plot takes about 16 seconds elapsed time, while
LivePlot does the same thing without slowing anything down at all.
