XPER (eXplainable PERformance) is a methodology designed to measure the specific contribution of the input features to the predictive performance of any econometric or machine learning model. XPER is built on Shapley values and interpretability tools developed in machine learning but with the distinct objective of focusing on model performance (AUC,
The library has been tested on Linux, MacOSX and Windows. It relies on the following Python modules:
Pandas Numpy Scipy Scikit-learn
XPER can be installed from PyPI:
pip install XPER
After a correct installation, you should be able to import the module without errors:
import XPERimport XPER
from XPER.datasets.load_data import loan_status
import pandas as pd
from sklearn.model_selection import train_test_split
loan = loan_status().iloc[:, :6]
X = loan.drop(columns='Loan_Status')
Y = pd.DataFrame(loan['Loan_Status'])
X_train, X_test, y_train, y_test = train_test_split(X, Y, test_size=0.15, random_state=3)from xgboost import XGBClassifier
import xgboost as xgb
# Create an XGBoost classifier object
gridXGBOOST = xgb.XGBClassifier(eval_metric="error")
# Train the XGBoost classifier on the training data
model = gridXGBOOST.fit(X_train, y_train)from XPER.compute.Performance import ModelPerformance
# Define the evaluation metric(s) to be used
XPER = ModelPerformance(X_train, y_train, X_test, y_test, model)
# Evaluate the model performance using the specified metric(s)
PM = XPER.evaluate(["AUC"])
# Print the performance metrics
print("Performance Metrics: ", round(PM, 3))For use cases above 10 feature variables it is advised to use the default option kernel=True for computation efficiency ➡️
# Option 1 - Kernel True
# Calculate XPER values for the model's performance
XPER_values = XPER.calculate_XPER_values(["AUC"])
# Option 2 - Kernel False
# Calculate XPER values for the model's performance
XPER_values = XPER.calculate_XPER_values(["AUC"],kernel=False)import pandas as pd
from XPER.viz.Visualisation import visualizationClass as viz
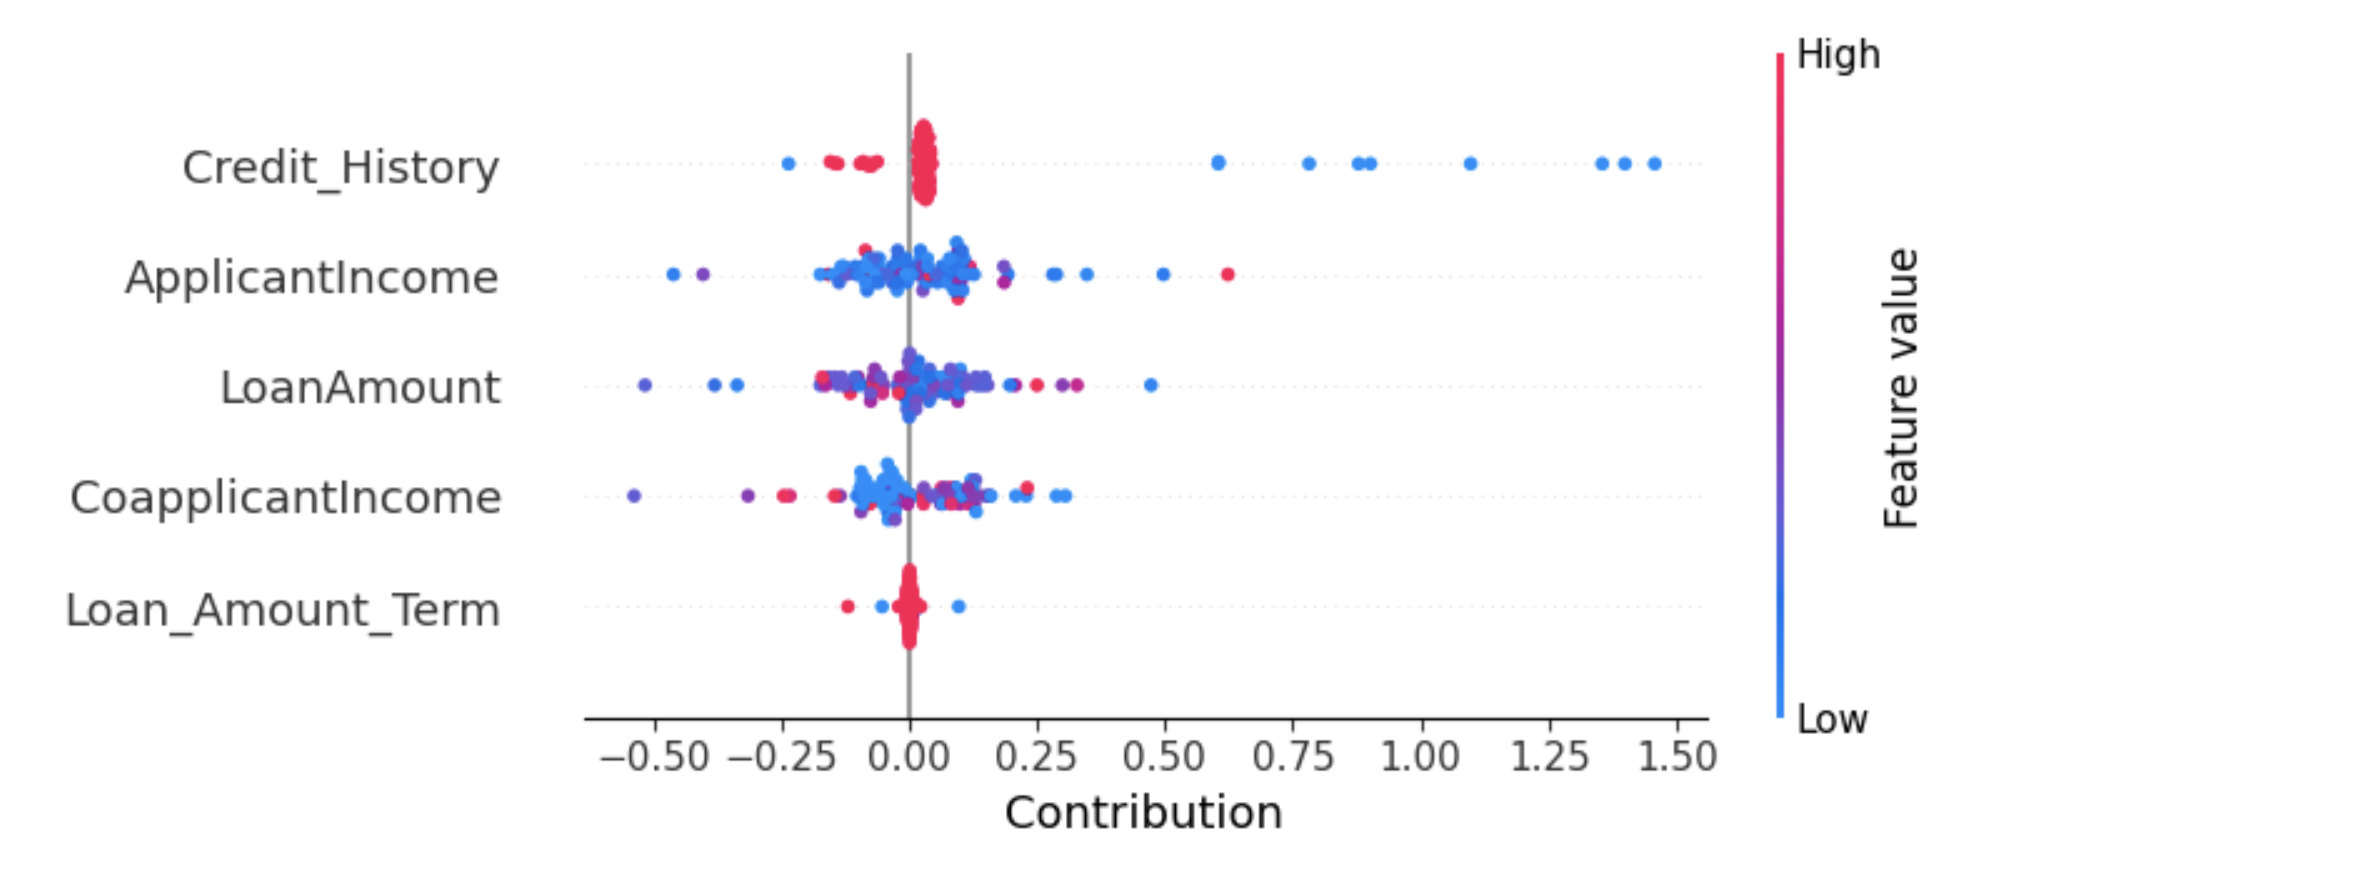
labels = list(loan.drop(columns='Loan_Status').columns)viz.bar_plot(XPER_values=XPER_values, X_test=pd.DataFrame(X_test), labels=labels, p=6,percentage=True)viz.beeswarn_plot(XPER_values=XPER_values,X_test=pd.DataFrame(X_test),labels=labels)viz.force_plot(XPER_values=XPER_values, instance=1, X_test=X_test, variable_name=labels, figsize=(16,4))The contributors to this library are
Hué, Sullivan, Hurlin, Christophe, Pérignon, Christophe and Saurin, Sébastien. "Measuring the Driving Forces of Predictive Performance: Application to Credit Scoring". HEC Paris Research Paper No. FIN-2022-1463, Available at https://ssrn.com/abstract=4280563 or https://arxiv.org/abs/2212.05866, 2023.


