A comparison of CenterNet and other State-of-the-art models in object detection
To download testing videos, go to videos folder and run the download.sh script. Videos will be downloaded one by one.
cd videos
sh download.sh
To test the detection models (yolo and centernet) on an individual image, execute the command:
python3 test.py --model <model_name> --input <path_to_image>
Where :
- model_name : Is the name of the model you want to test ("yolo" or "center").
- input : Path to the image file.
To test the detection models (yolo and centernet) on a video, execute the command:
python3 test_video.py --model <model_name> --input <path_to_video>
Where :
- model_name : Is the name of the model you want to test ("yolo" or "center").
- input : Path to the video file.
The script will output the prediction in the form of gif into the default path "videos/output.gif". However, you can change this by providing the script with another option "--output" which specifies the output GIF path. For example :
python3 test_video.py --model yolo --input videos/video_1.mp4 --output videos/output_1.gif
| Video #1 - Yolo | Video #2 - Yolo | Video #3 - Yolo |
|---|---|---|
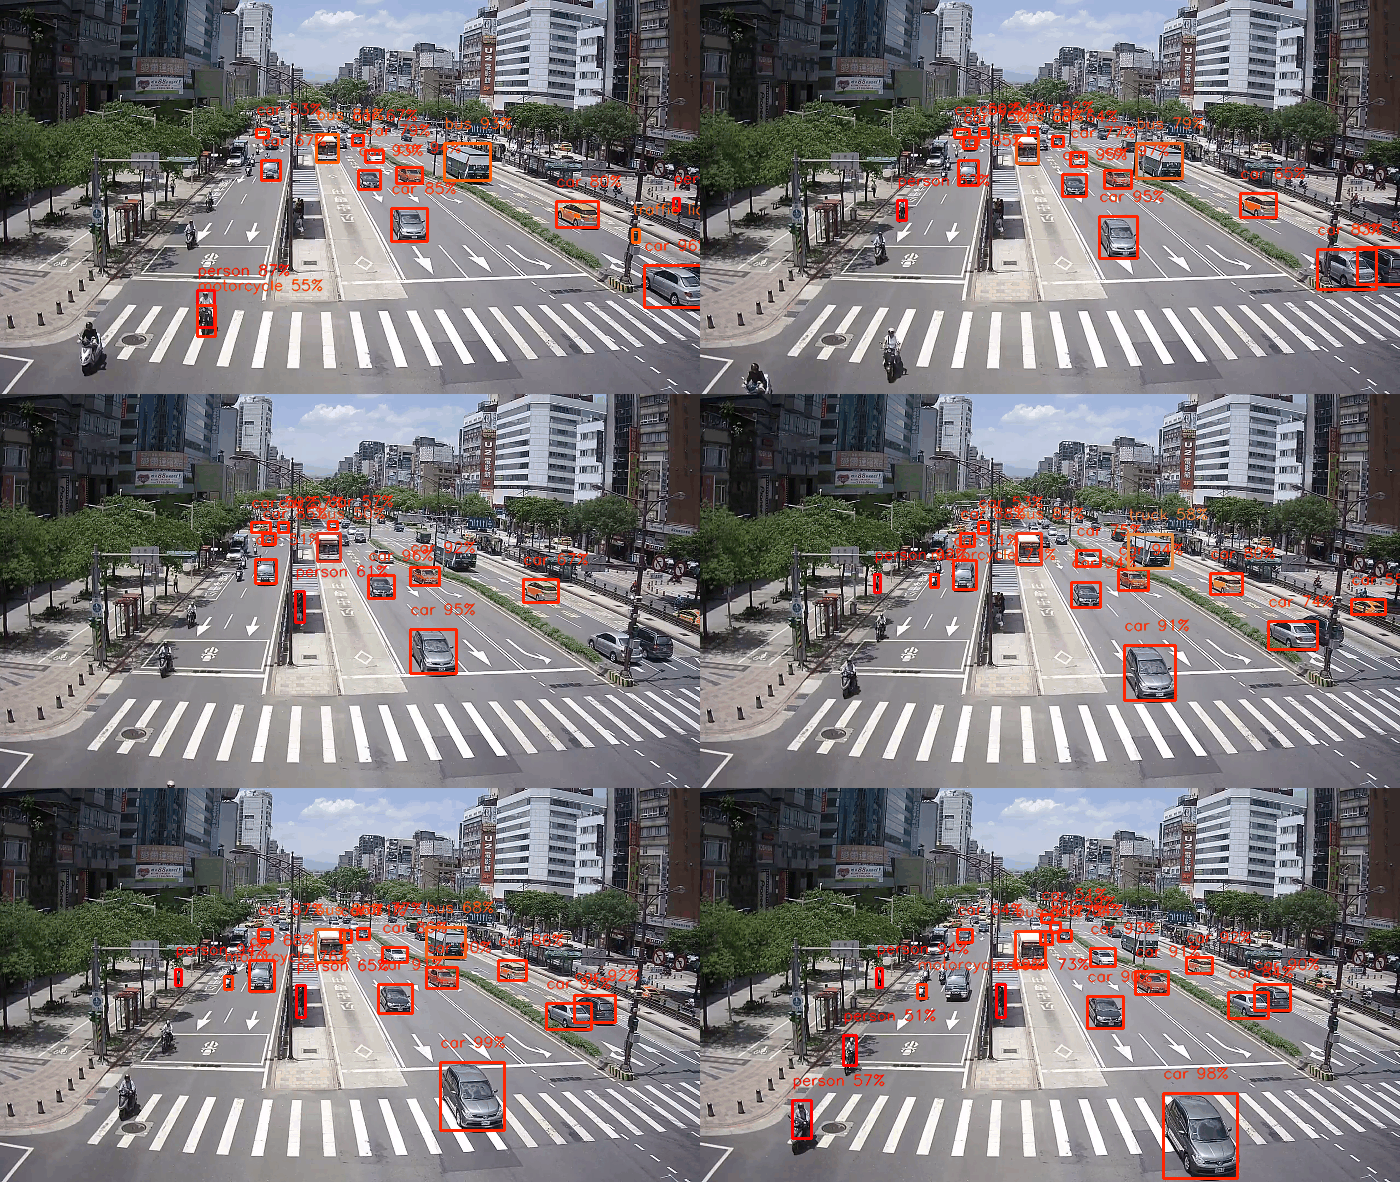 |
 |
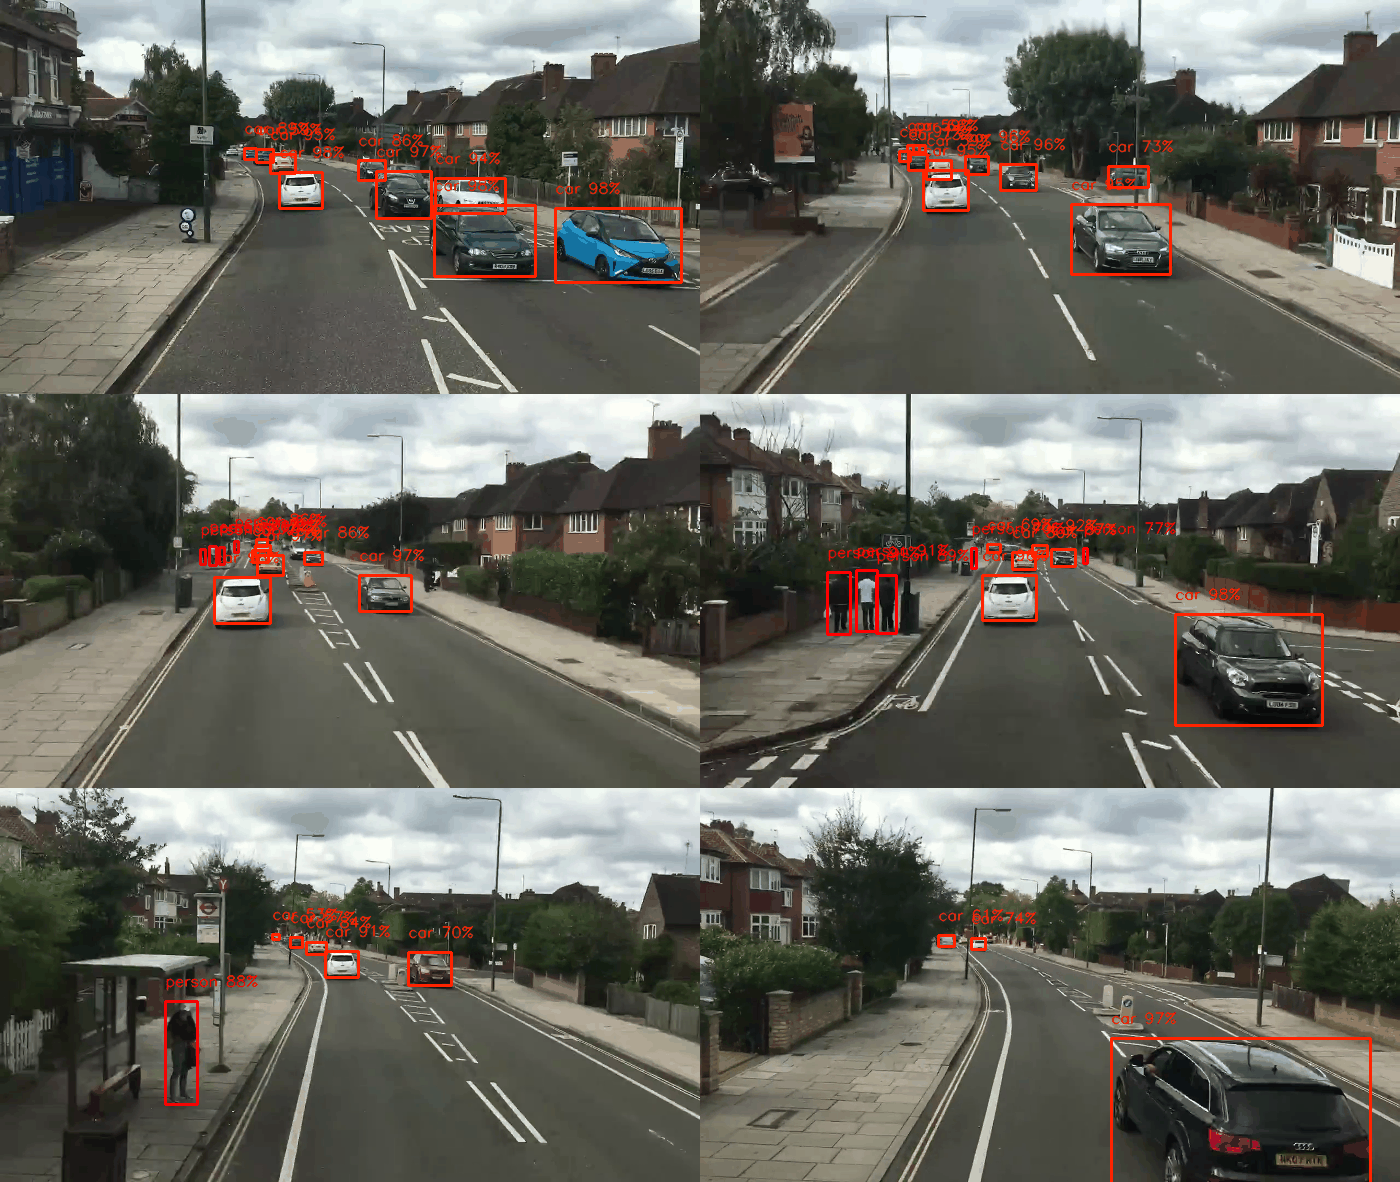 |
| Video #1 - CenterNet | Video #2 - CenterNet | Video #3 - CenterNet |
|---|---|---|
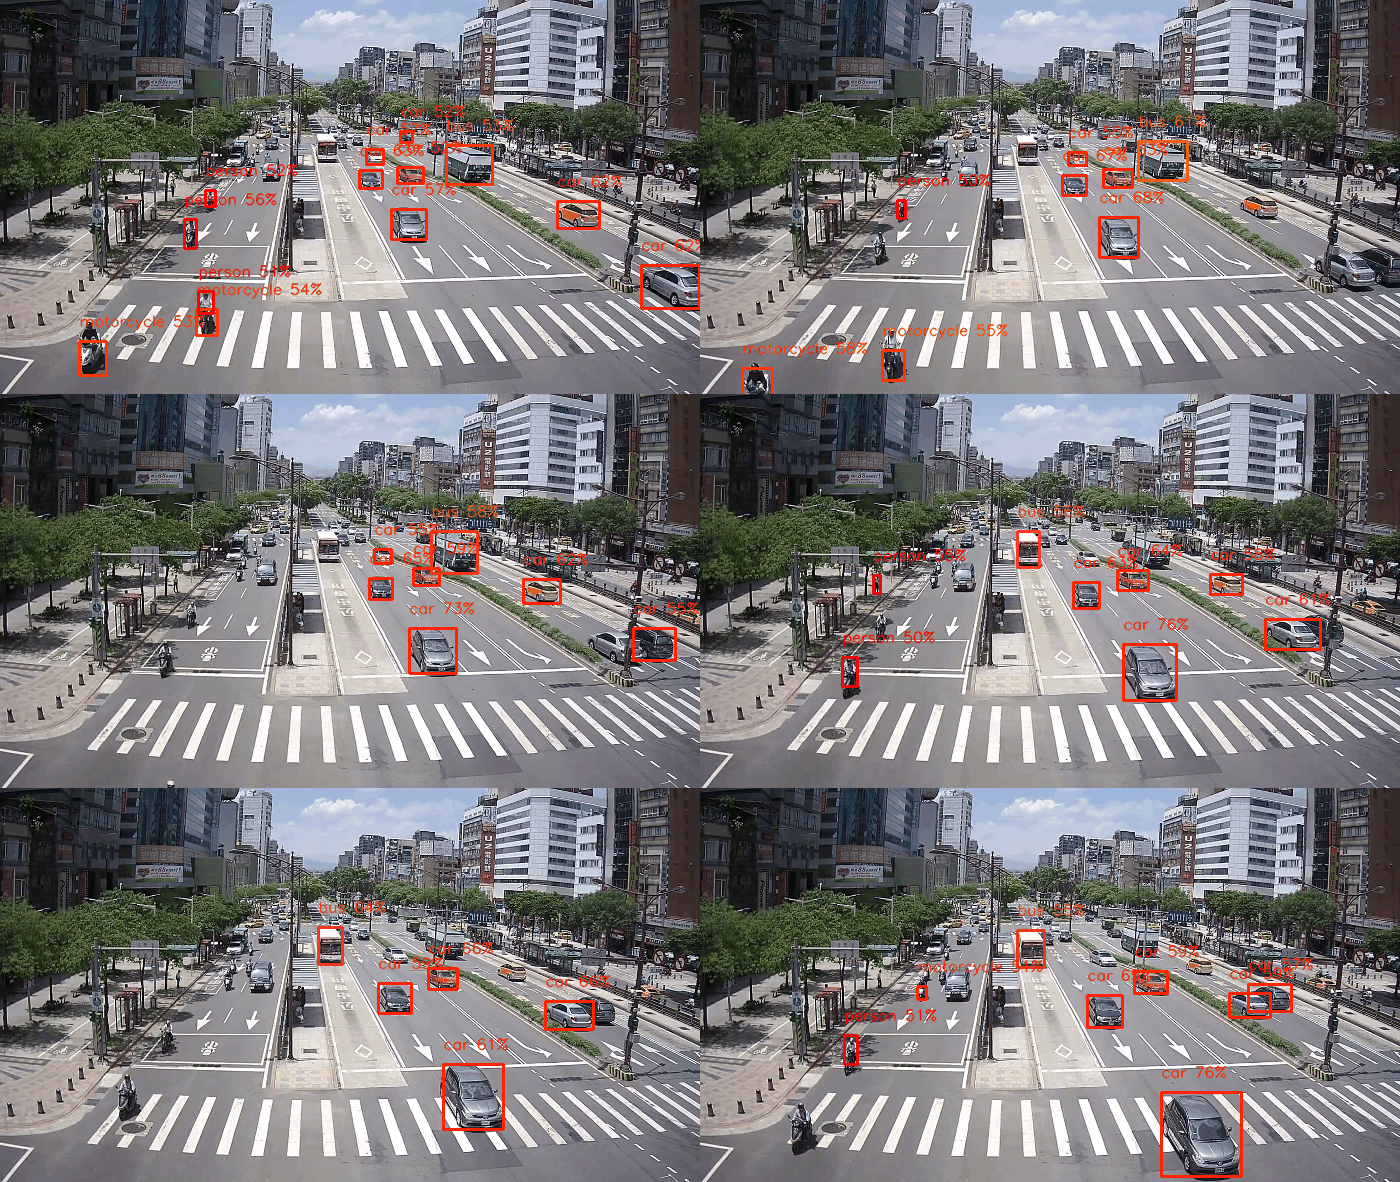 |
 |
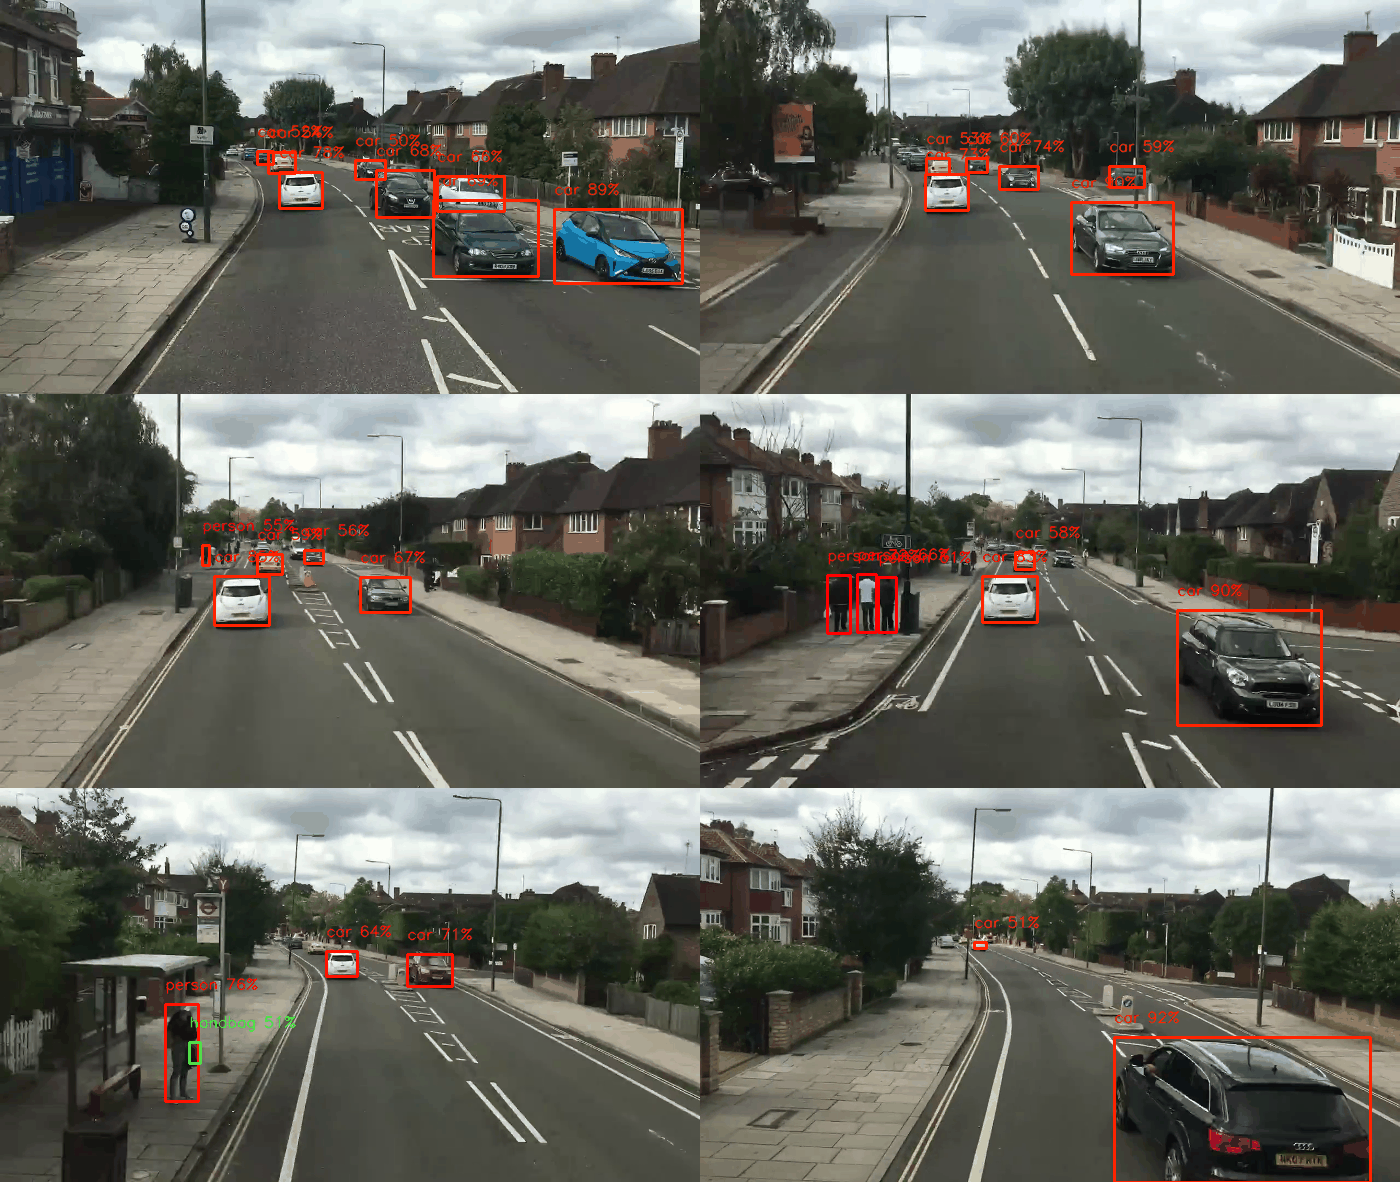 |
To evaluate on a testing dataset, run the "test_batch.py" script and specify the path to the testing images folder along with the model name. For example :
python3 test_batch.py --input data/images --model yolo
The results will be output to a json file : "predictions/pr_{model_name}.json". The format of the json file will be as followed:
{
	"<class_name>" : {
		"<file_name>.jpg" : {
			"boxes" : [[...]],
			"scores" : [...]
		},
		...
	},
	...
}
The ground truth of the vehicle dataset is stored in the ground truth json file "predictions/gt_vehicle.json". To plot the precision-recall curve of the predictions, run the "pr_curve.py" script and specify the JSON files to the ground truth and the predictions JSON. For example :
python3 pr_curve.py --gt predictions/gt_vehicle.json --pr predictions/pr_yolo.json
The figure will be output to a file named "PR_curve.png". However, you can change this behaviour by specifying an option "--output" to the pr_curve.py script.
| Yolo | CenterNet |
|---|---|
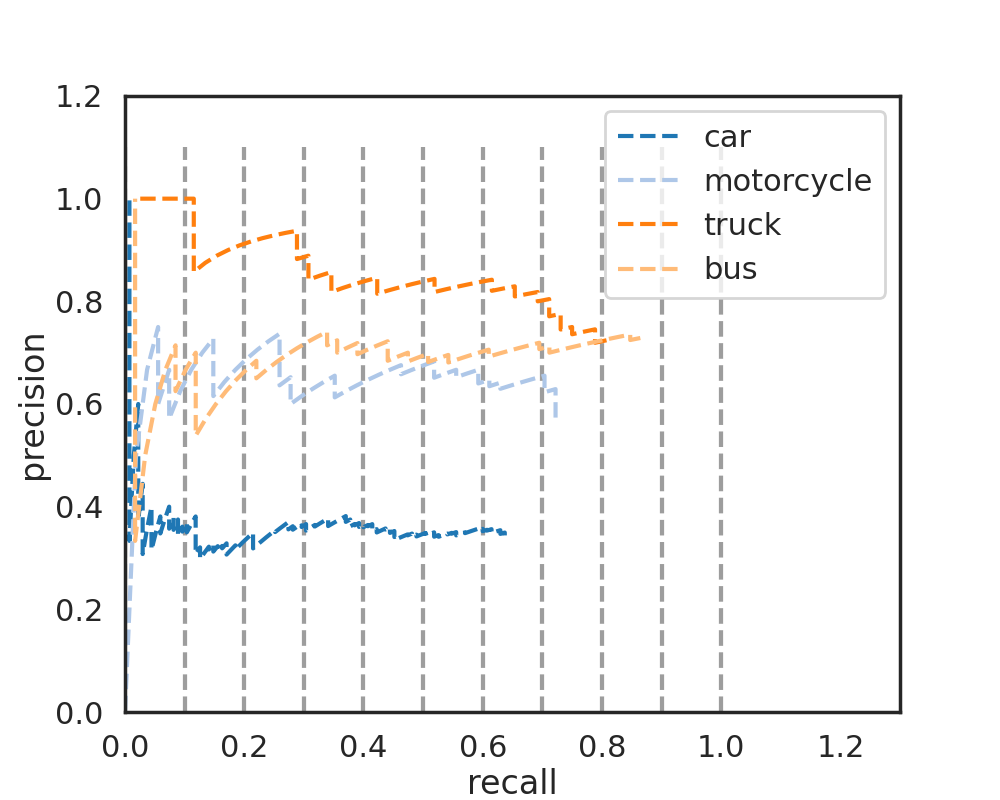 |
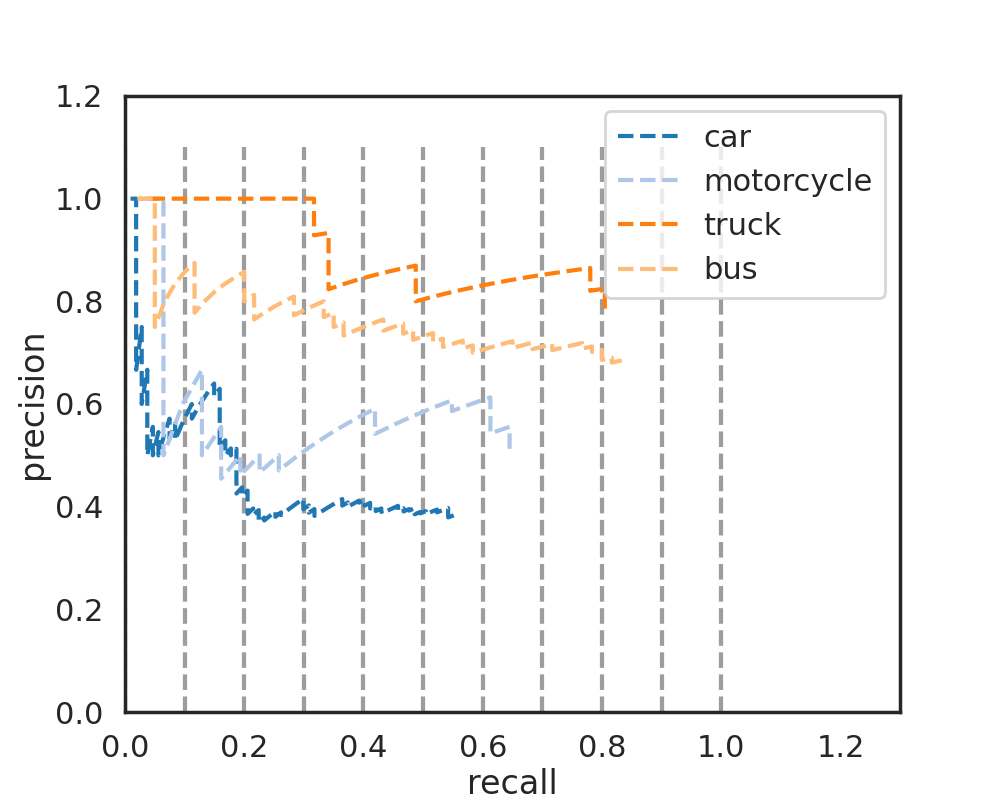 |
| mAP | Car | Truck | Bus | Motorcycle |
|---|---|---|---|---|
| CenterNet | 0.39 | 0.76 | 0.69 | 0.46 |
| Yolo | 0.30 | 0.71 | 0.61 | 0.50 |
To evaluate the performance of CenterNet and YoloV3 in real-time detection, the "measure_performance.py" script is written to measure in two metrics : Frames per second (FPS) and Detection rate (Objects per frame). To run the script, provide it with the following options:
python3 measure_performance --model <model_name> --input <path_to_video> --metric <metric_name>
Where:
- model_name : Refers to the model name ("center" or "yolo").
- path_to_video : Refers to path to video input ("videos/...mp4").
- metric_name : Refers to evaluation metrics ("fps" or "dr").
Performance metrics comparison summary:
| FPS | Detection Rate |
|---|---|
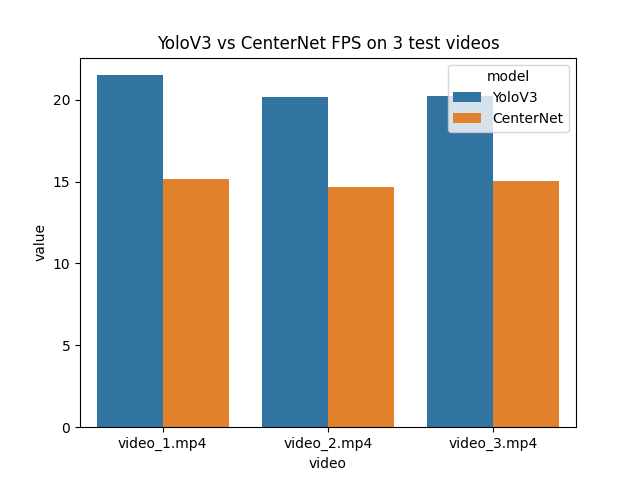 |
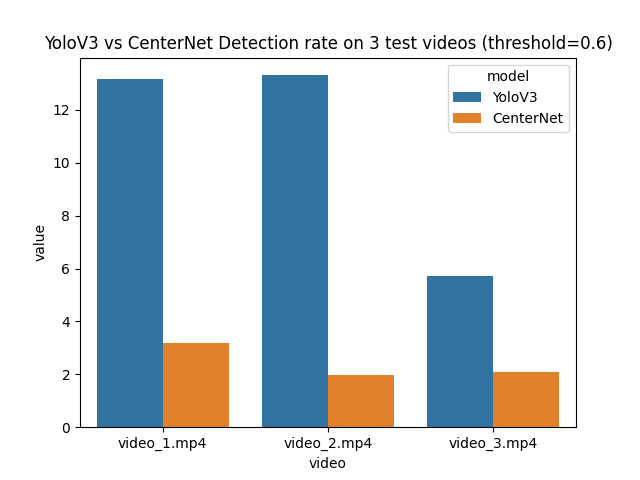 |
To evaluate the model's complexity, simply run the script "flops.py" (without providing any options). The script imported the HourGlass-104, ResNet-18, ResNet-101 and DLA-34 architectures (implemented in PyTorch) from the original CenterNet implementation. Then, it uses ptflops to compute the network size (number of parameters) and complexity (GMacs). Output from the script :
[INFO] Model name : HourGlass-104, Number of params : 190.18 M, Computational complexity : 275.1 GMac
[INFO] Model name : DLA-34, Number of params : 18.37 M, Computational complexity : 29.53 GMac
[INFO] Model name : ResNet-18, Number of params : 15.68 M, Computational complexity : 38.25 GMac
[INFO] Model name : ResNet-101, Number of params : 53.3 M, Computational complexity : 76.17 GMac
- Test and visualize the detection results on the testing youtube videos.
- Calculate the model complexity using FLOPS on ResNet (18 - 101), HourGlass-104 and DLA-34 architectures.
- Comparison with YoloV3:
- Compare the FPS rate of CenterNet vs YoloV3 on given videos.
- Visualize the Precision-Recall curve on a vehicle dataset for both models.
- Plot the ROC curves for both models.
- Read paper reviews and discuss limitations and possible improvements for CenterNet.
- GluonCV: Testing pre-trained CenterNet models : Link
- GluonCV: Testing pre-trained YoloV3 models : Link
- GluonCV: Model zoo : Link
- CenterNet Paper - Objects as Points : Link
- Vehicle dataset for validation : Link
- Precision-recall curve for object detection : Link
- How to interpret a precision-recall curve : Link
- Original CenterNet Github repository : Link