


A BI dashboard desgined using AWS QuickSight by leveraging Adidas US sales data consolidated in an AWS RDS PostgreSQL database.
├── LICENSE
├── README.md              <- The top-level README for developers using this project
└──  readme-assets         <- Contains images to be used in README.md
Before you begin, ensure you have met the following requirements:
- You have a
Linux/Mac/Windowsmachine. - You have installed
PostgreSQLand a pgsql client likepgAdmin. - You have created an account on
AWSandAWS Quicksight. Accounts have to be created for both separately.
NOTE: I've used AWS Free Tier to do this project.
The architecuture diagram is as follows:

A brief overview of steps to reproduce the project is as follows:
- Download the Adidas US Sales Dataset PostgreSQL dump from data.world to your local system.
- Create a publicly accessible AWS Relational Database Service (RDS) instance with PostgreSQL database engine, and restrict access to your personal IP address by adjusting the inbound rules in the security group.
- Connect AWS RDS instance to pgAdmin on local system using the instance server endpoint and credentials.
- Import the PostgreSQL dump of the Adidas sales data into a newly created empty database on AWS RDS.
- Run filtering and analysis queries, and adjust data types as necessary (e.g. converting
VARCHARtoFLOATandINT) on the imported database table. - On AWS, restrict public access to the RDS instance and create 2 security groups, one for RDS and the other for QuickSight. Enable bi-directional traffic flow between the two services by modifying inbound and outbound rules in both security groups. Finally, associate the RDS security group with the RDS instance.
- On AWS QuickSight, log in and create a VPC connection to the RDS instance for private communication. By setting up security groups on AWS and a VPC connection on QuickSight, back-and-forth communication between the two will be facilitated within the VPC.
This a screenshot of the dashboard:

I'll give a brief description of each dashboard component/plot and insights gained from it:
-
Line graph
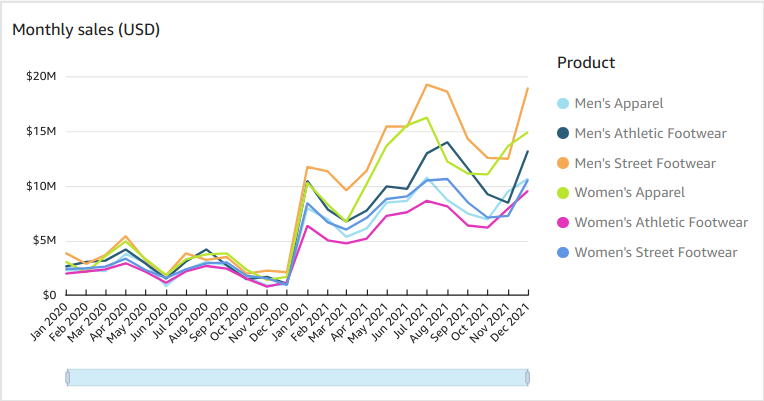
The graph showcases the sales performance of various product lines from 2020 to 2021. It is evident that "Men's Street Footwear" (represented by the orange line) was the top-performing product line, while "Women's Street Footwear" (represented by the magenta line) had the lowest sales.
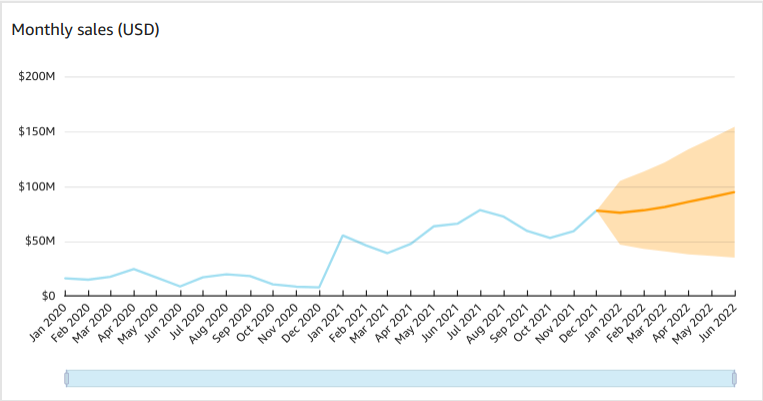
Additionally, the QuickForest algorithm, which is integrated within QuickSight, generates forecasts. The projected total sales for the month of January 2022 are estimated to be $118 million.
-
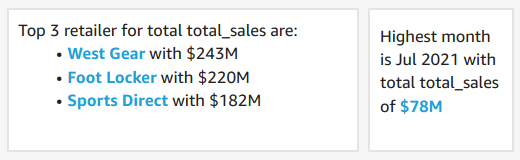
Donut chart
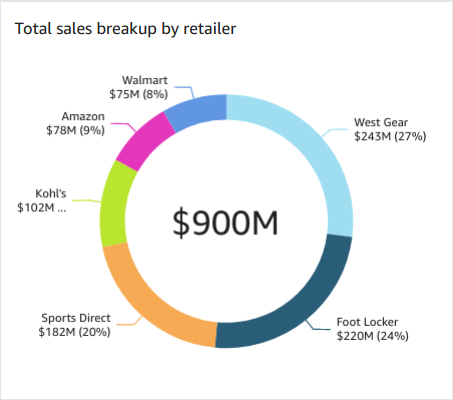
The graph displays the distribution of total sales among retailers from 2020 to 2021. Westgear recorded the highest sales, accounting for 27% of the total, followed closely by Footlocker with 24%. On the other hand, Walmart had the smallest share, accounting for 8% of total sales.
-
Map
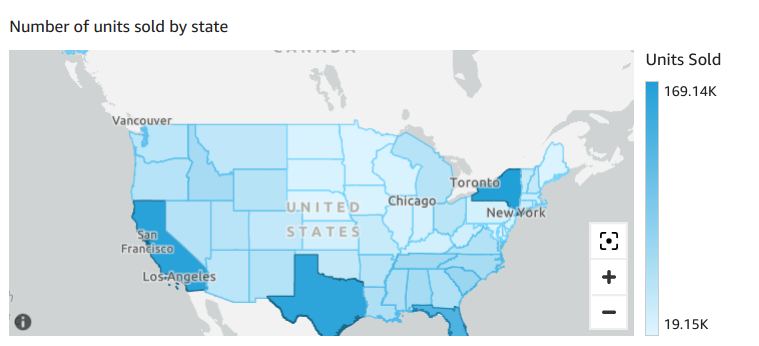
The map illustrates the distribution of product units sold across various states. New York recorded the highest number of units sold, followed by California and Texas. Conversely, Nebraska had the lowest number of units sold.
-
KPI
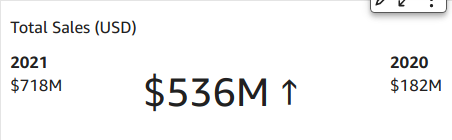
This key performance indicator showcases the growth in sales from 2020 to 2021. The sales in 2020 were $182 million, which rose to $718 million in 2021, resulting in an increase of $536 million.
-
Insights auto-generated by QuickSight


- Authorizing connections from Amazon QuickSight to Amazon RDS DB instances
- Amazon QuickSight
- data.world
Distributed under the MIT License. See LICENSE.txt for more information.