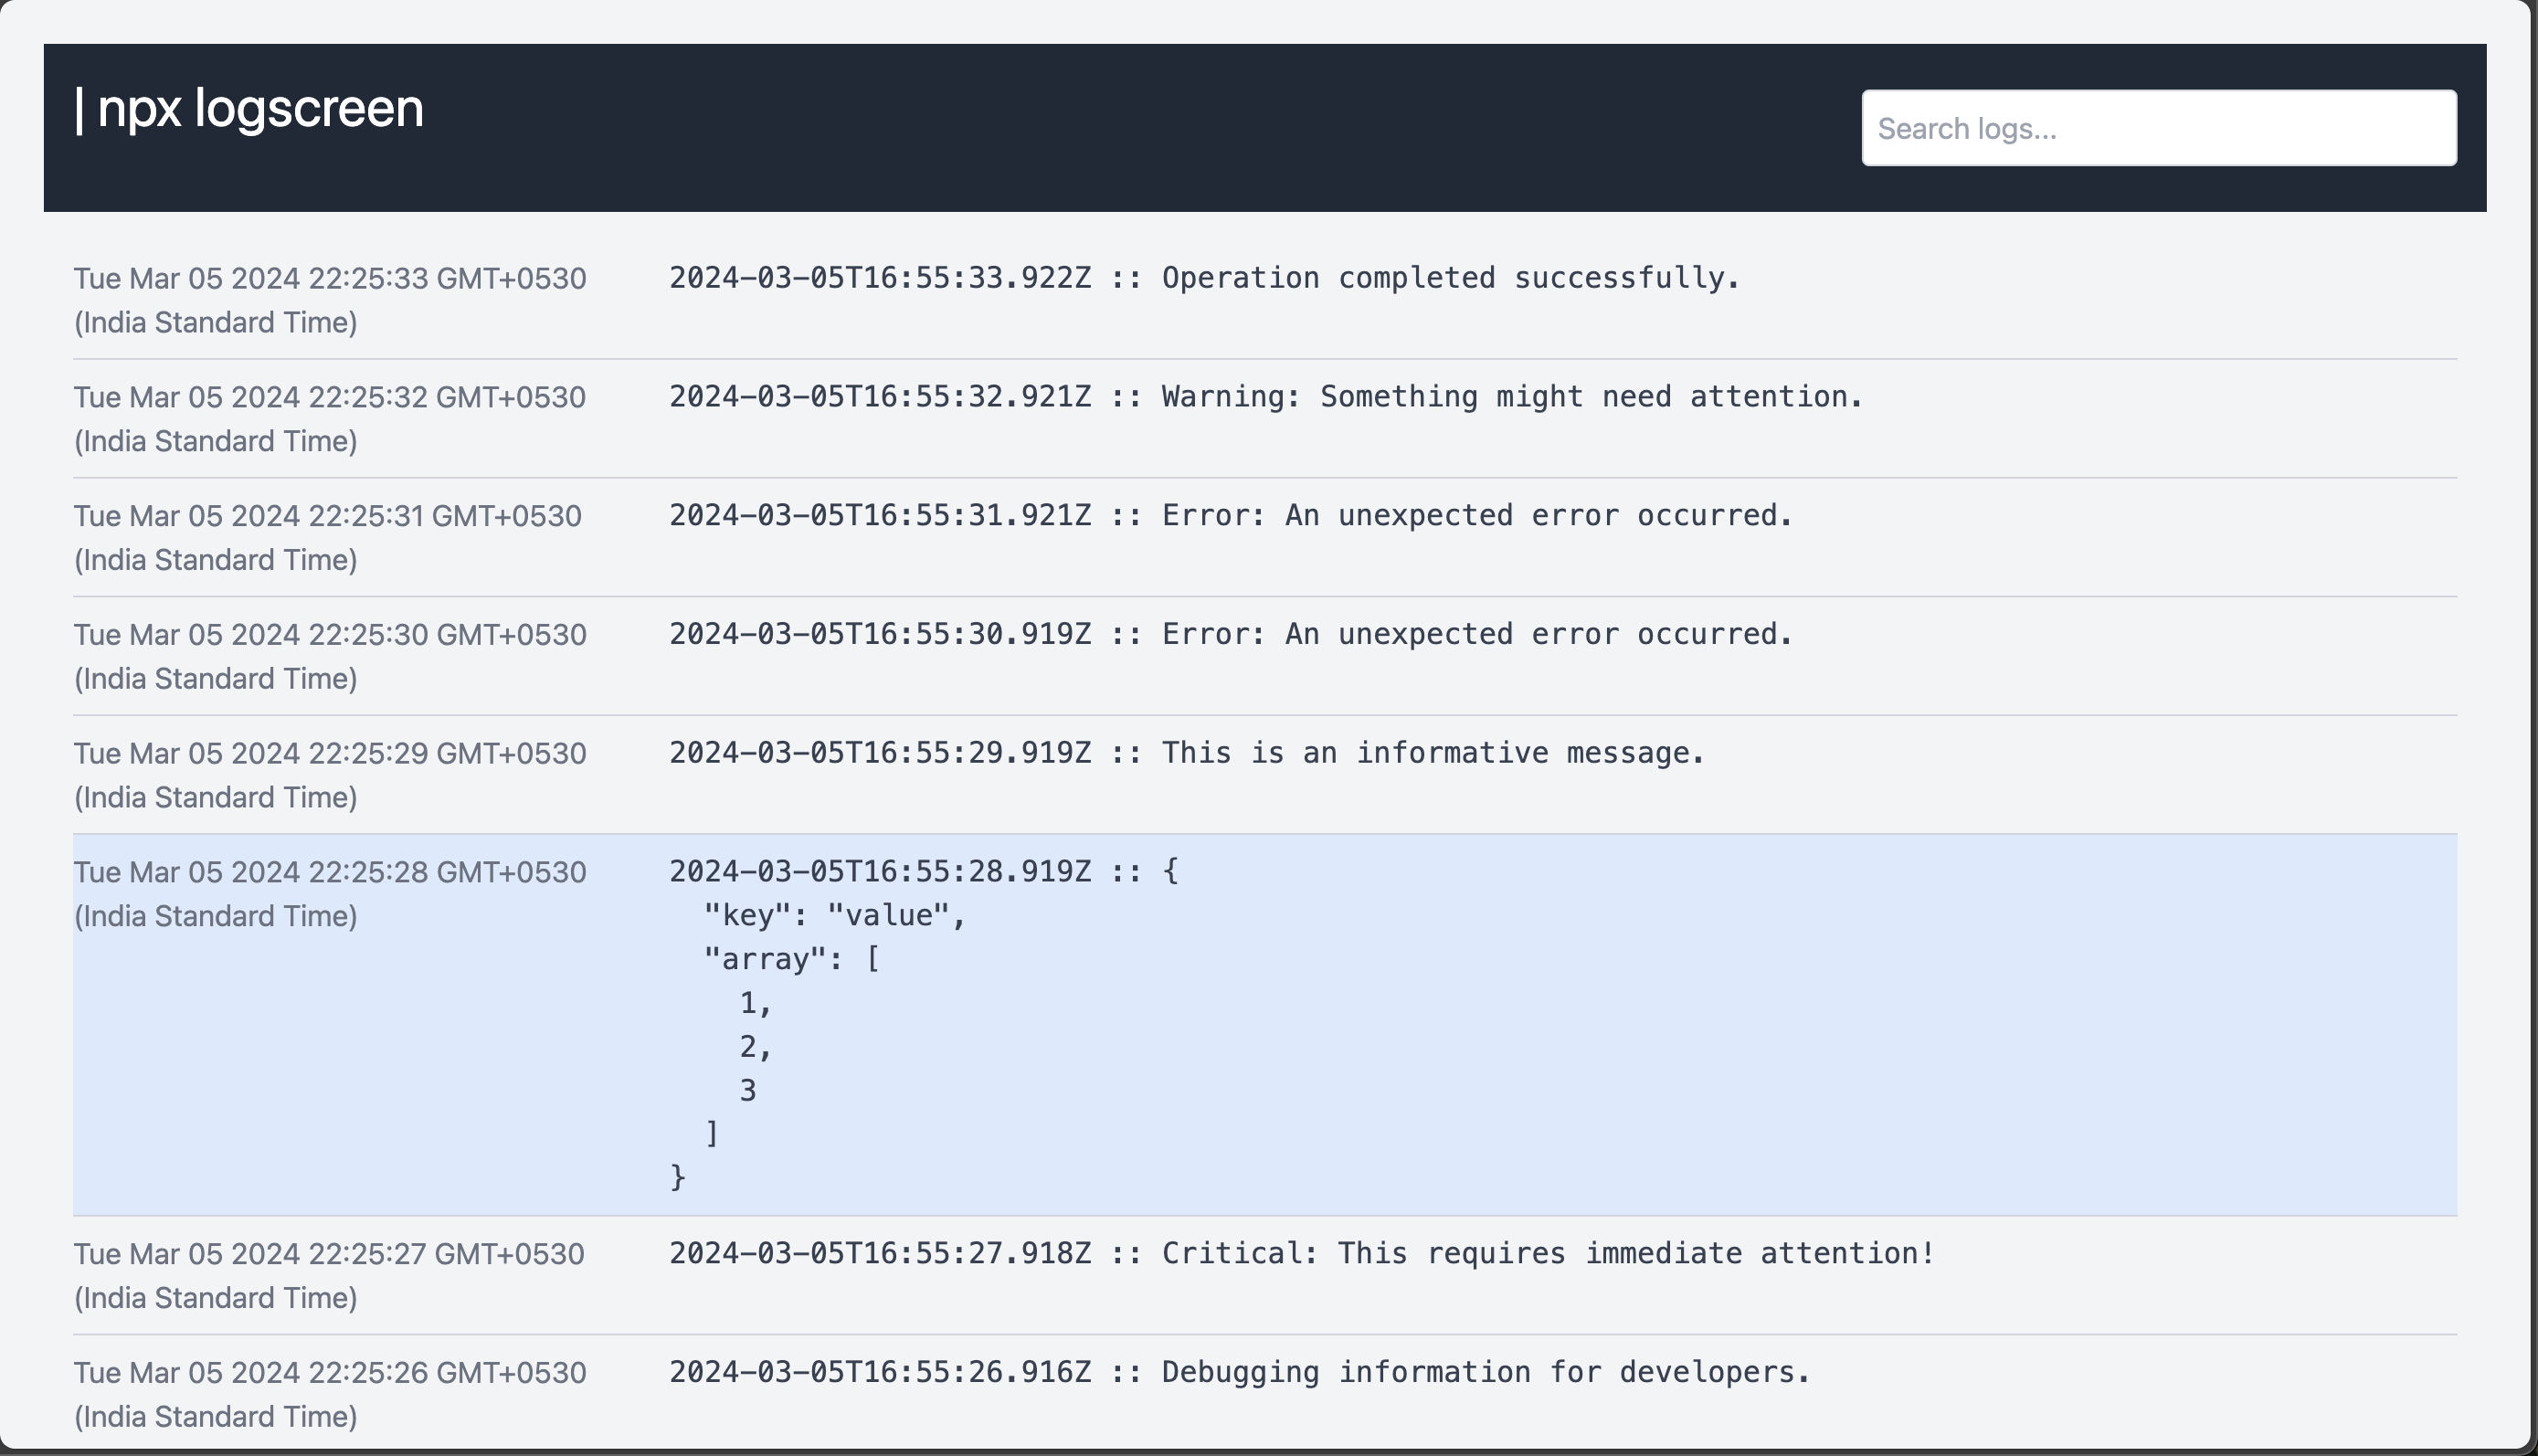
💻 Hard to search logs?
LogScreen simplifies the process. Piping logs, visualizing in a web app – it's that easy!
This tool has been generated entirely with ChatGPT and hence it is also a demonstration of how useful products can be developed with collaborative reiteration with GPTs.
After installation, you can use LogScreen to view command outputs in a browser:
command | npx logscreenReplace command with the actual command you want to execute. LogScreen will start a local server and open the logs in your default web browser.
Here are some examples:
docker-compose up | npx logscreenThis example pipes the logs from a Docker Compose service into LogScreen, providing a more readable and interactive log view.
npm start | npx logscreenIf you have a Node.js project with an `npm start` script, you can use LogScreen to monitor and navigate through the logs as your application runs.
tail -f /var/log/syslog | npx logscreenFor Linux users, you can use LogScreen with the `tail` command to follow and visualize real-time updates in system logs.
ssh user@remote-server 'tail -f /path/to/logs' | npx logscreenSSH into a remote server and tail logs in real-time using logscreen for diagnosing issues on a production server.
tail -f /var/log/nginx/access.log | npx logscreenTail Nginx access logs to observe incoming requests, response codes, and other relevant information.
tail -f /var/log/apache2/error.log | npx logscreenMonitor Apache error logs to identify issues with your web server.
Use logscreen to monitor logs from Google Cloud Functions, gaining insights into function executions, errors, and overall performance.
gcloud functions logs read <function-name> | npx logscreenkubectl logs -f <pod-name> | npx logscreenaws logs tail /aws/lambda/<function-name> | npx logscreenssh -i <private-key.pem> ec2-user@<instance-ip> 'tail -f /var/log/<your-log-file>' | npx logscreenTail logs related to database queries on a Heroku Postgres database for performance analysis and optimization.
heroku pg:psql --app <your-app-name> -c "tail -f /var/log/postgresql/postgresql.log" | npx logscreenReplace the commands above with your specific use case to leverage the benefits of LogScreen's web-based log viewer.
- Web-Based Log Viewer: Get a cleaner and more organized view of command outputs.
- Real-Time Updates: Logs are displayed in real-time as the command executes.
- Interactive Interface: Search, filter, and navigate through logs easily. // TODO
-
Port: By default, LogScreen uses port 3000. You can specify a different port using the
-por--portoption:command | npx logscreen --port 8080
