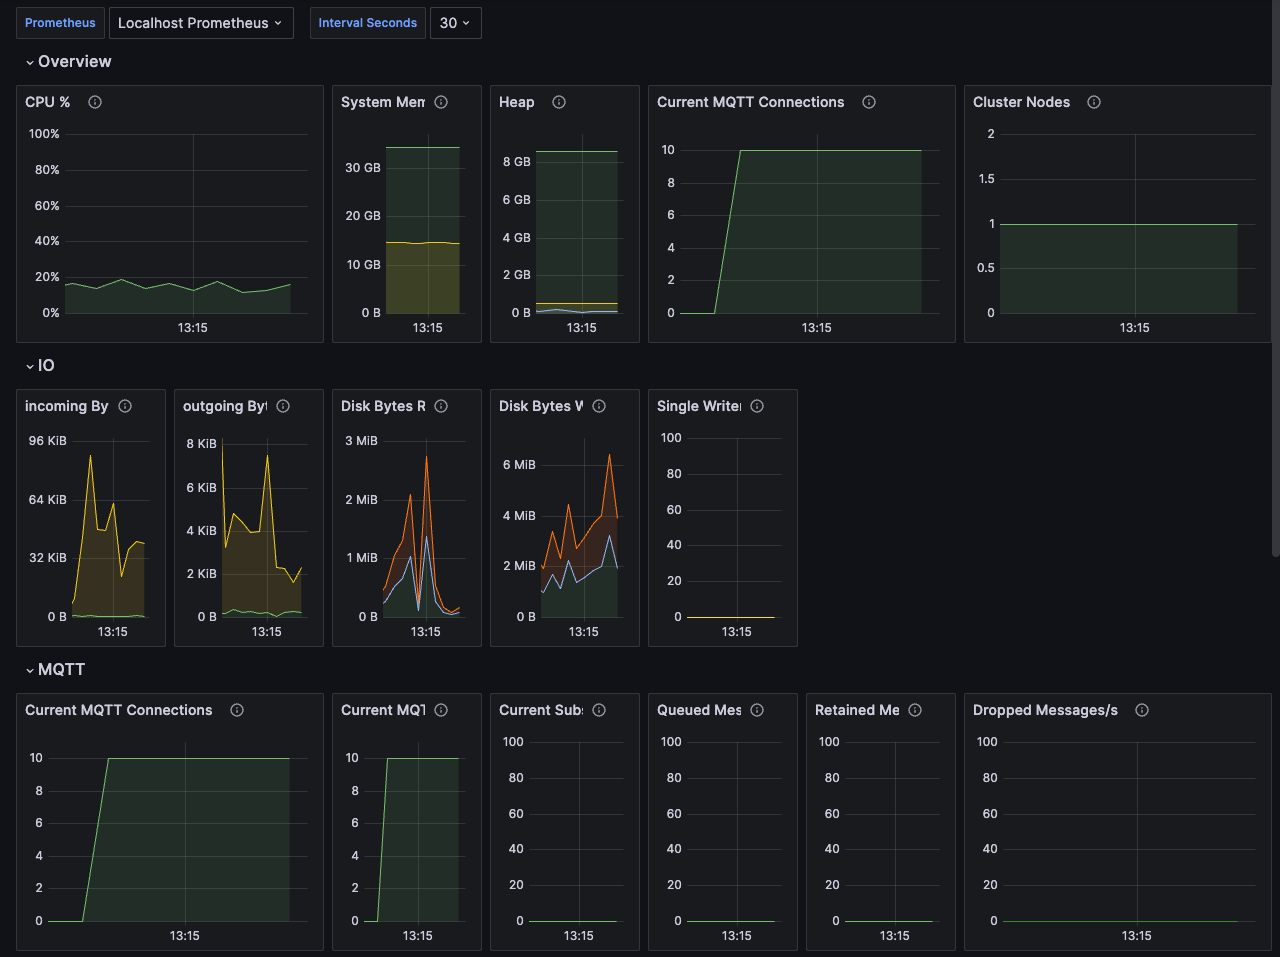
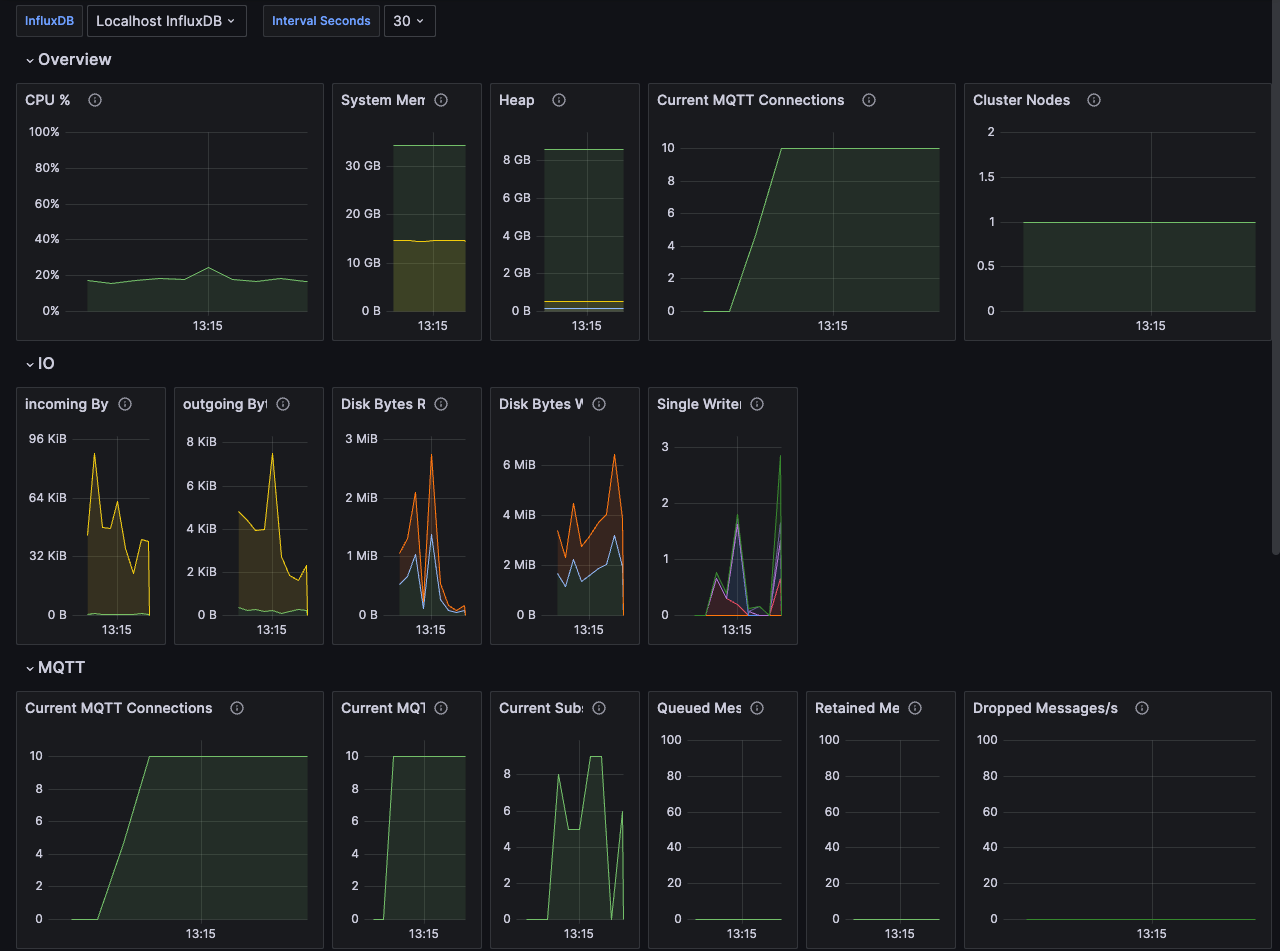
This repository offers Grafana Dashboards to Monitor the HiveMQ Platform. For simple conversions and better understandability all rates are displayed per second.
- A dashboard for Prometheus using PromQL.
- A dashboard for InfluxDB using Flux.
- Visualizations for the most important HiveMQ Platform metrics.
- Visualizations for the most important metrics of each HiveMQ Enterprise Extension.
We offer a dedicated dashboard for Prometheus using PromQL
- Configure your Prometheus data source.
- Download the dashboard as a json file.
- Import the downloaded json file in Grafana.
- Select your desired Prometheus data source in the top left corner of the Grafana Dashboard.
We offer a dedicated dashboard for InfluxDB using Flux.
- Configure your InfluxDB data source in Grafana. Make sure to configure Flux as the InfluxDB query language for the data source.
- Download the dashboard as a json file.
- Import the downloaded json file in Grafana.
- Select your desired InfluxDB data source in the top left corner of the Grafana Dashboard.
- If you want to request a feature or report a bug, please create a GitHub Issue using one of the provided templates
- If you want to make a contribution to the project, please have a look at the contribution guide


