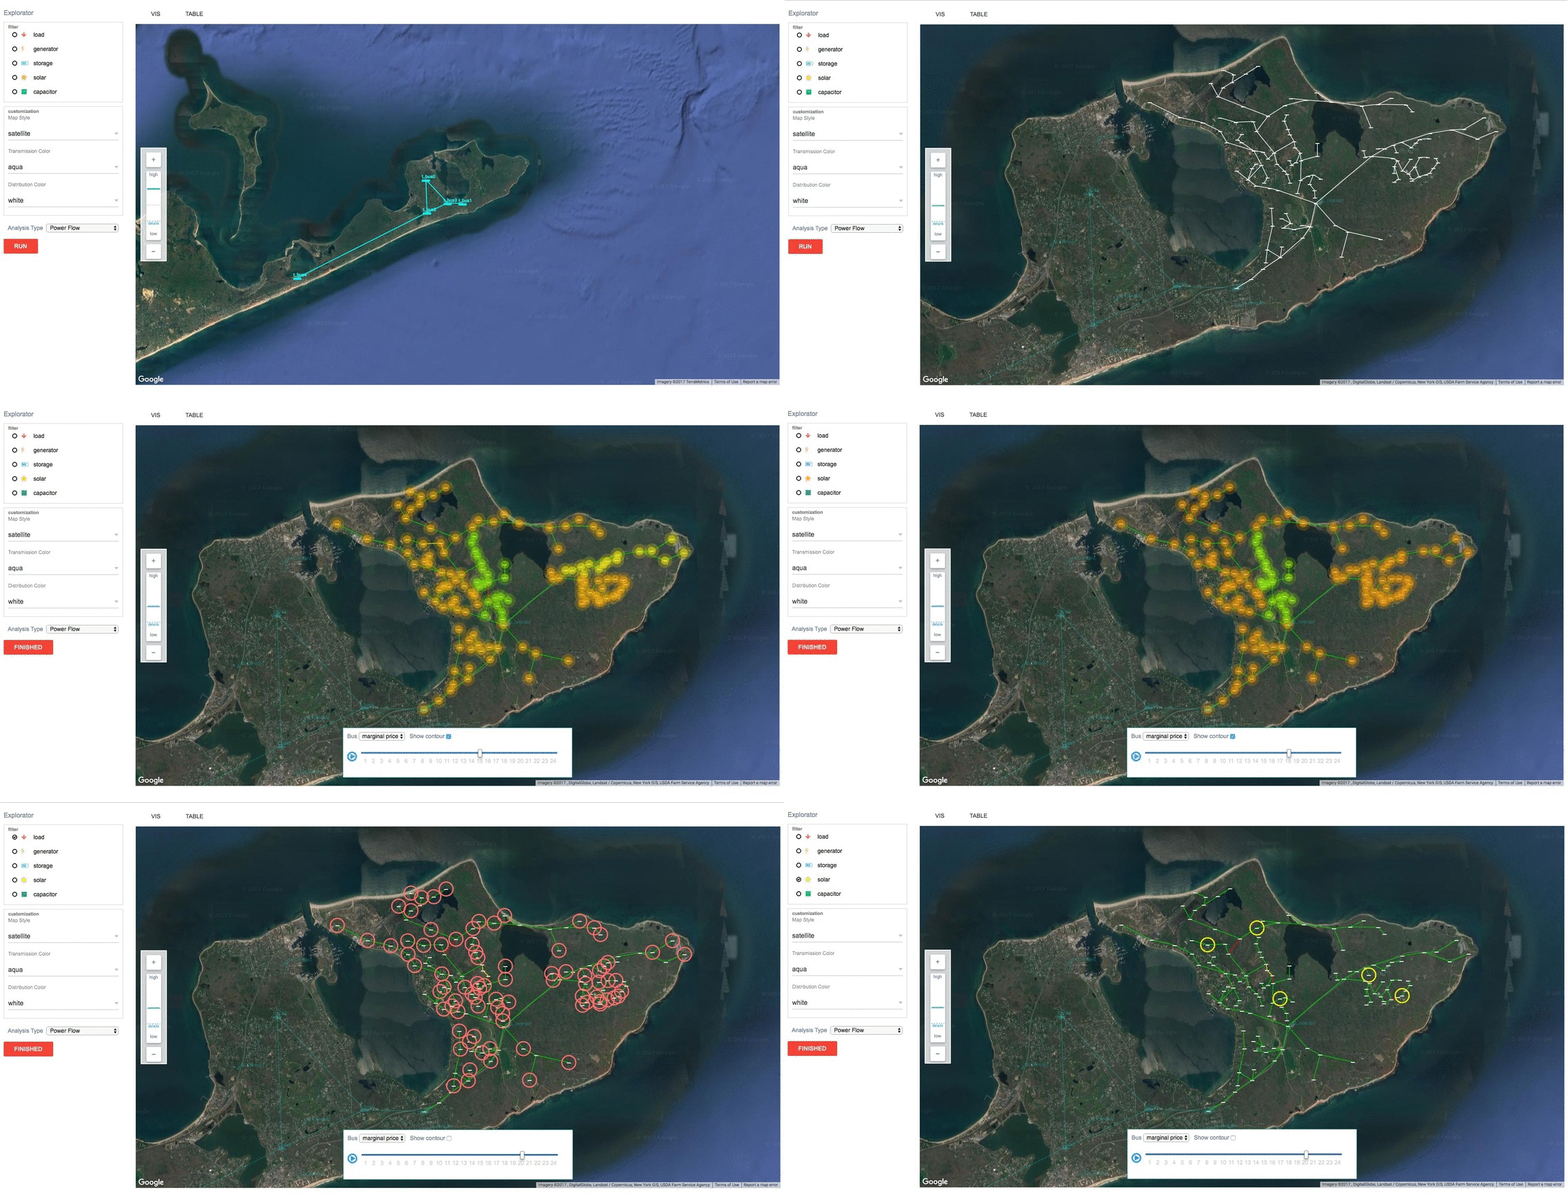
Due to sensitive data, the source code cannot be open source anymore. Below is several demo video links about the UI.
You can check the front end design to get and idea of the frontend code. None of these previous version is a pure React App as Google Map and D3 componenet are living outside the React controlled.
The core functionality of the white background vis is developed based on react-force
In the first stage, we focus on making the primary interface for the web application, and primary design for the backend application as well as the database.
For the frontend, I choose to use ReactJS + D3 to make the visualiztion, The reason is to maintain a uniform state for the front end and try to abstract the UI layer from the backend server.
For the backend, our team is using django with a relational database. We use django because:
- The legacy code is developed in flask.
- The team is more familiar with python, the ananlysis tool is developed in python.
- We want to make use of the ORM model provided by django to work with SQL database.
Provide an interface for user to clearly see the structure of a grid, and carry out CRUD manipulation on it. The grid system will be used as an input for smart power analysis tools.
I am going to carry out a user testing based on the current prototype. The details is in our team report.
