A small command line interface for visualizing gauge field configurations.
LatViz uses PyVista as backbone for creating the frames, then the frames are stitched together using either ImageMagick or ffmpeg.
There are two categories of animations which can be generated. One is from a single lattice configurations, the other is from a time series of configurations where a time slice has been specified.
This project was created by hmvege and giopede.
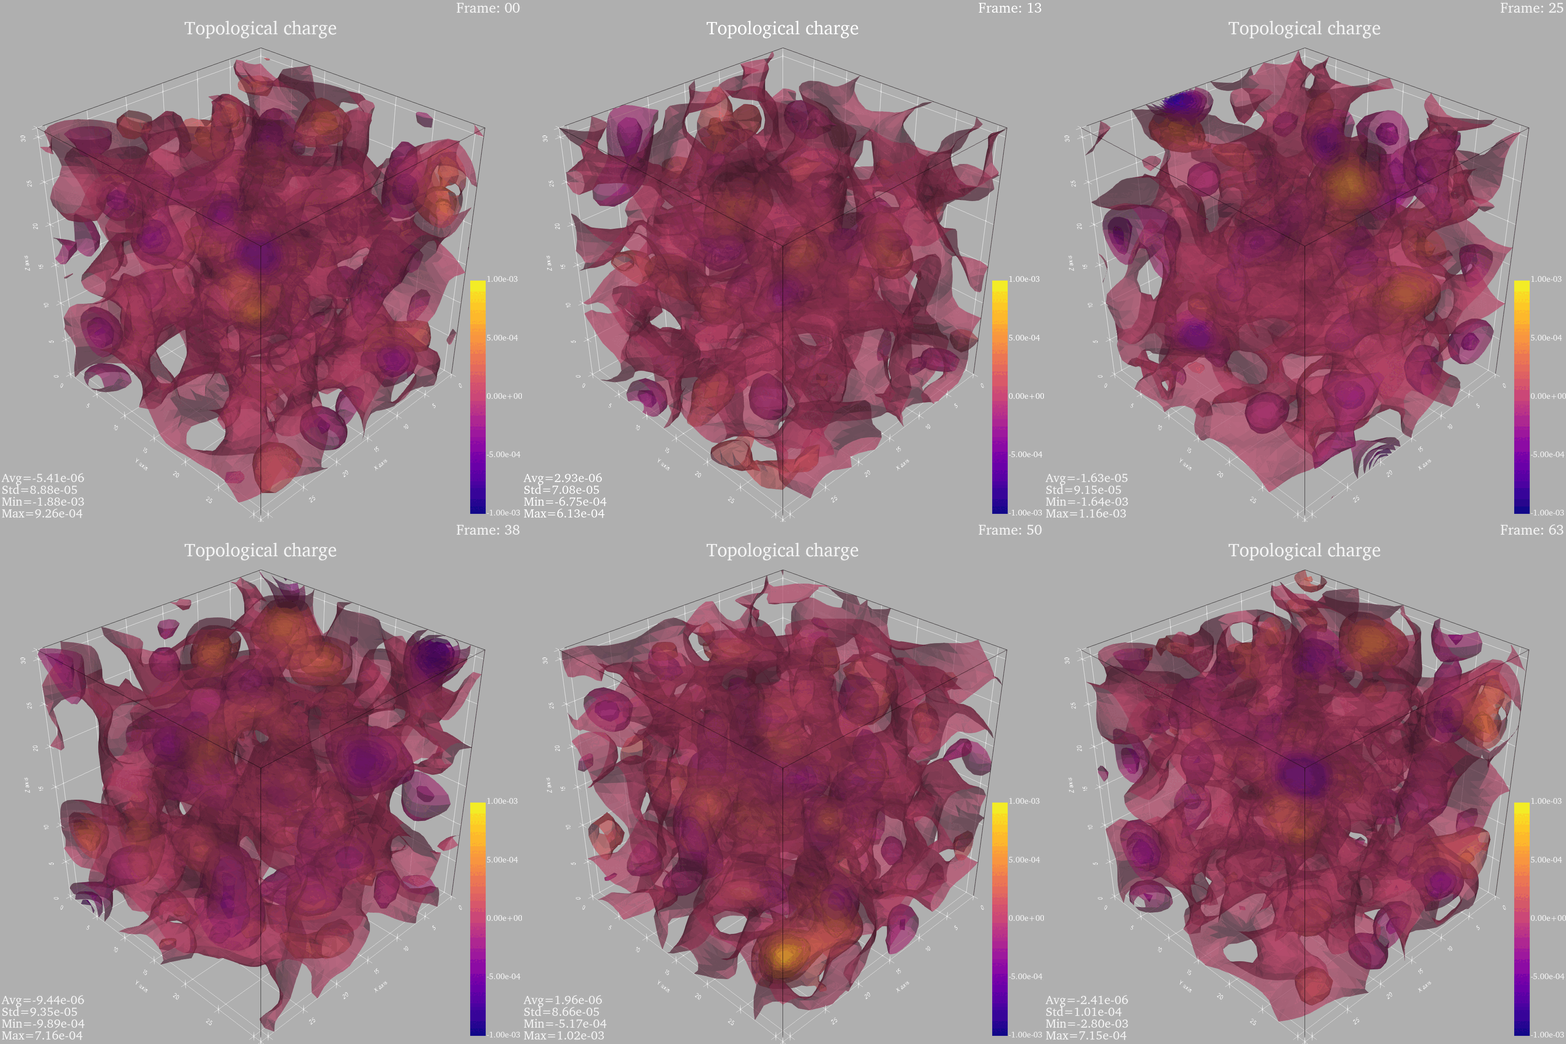
The topological charge of a gauge field.
Make sure following is installed,
- ImageMagick is needed in order to create the
aviandmp4animations. - ffmpeg is needed to create gifs.
MacOS:
brew install ffmpeg
brew install ImageMagick
Ubuntu:
sudo apt update
sudo apt install ffmpeg imagemagick
Ensure you have a clean Python 3.9>= environment, then install by pip
pip install latvizInstall development mode by,
pip install -e ".[dev]"
and then enable pre-commits by
pre-commit install
In its most basic usage, one needs to provide a file path to a binary file, spatial size of the hypercube, and the temporal size of the hyper cube(assuming shape of (NT, N, N, N)).
latviz path_to_field.bin -n spatial_size -nt temporal_size
If multiple files are passed in, LatViz will treat this as a time series, and by default select the first temporal slice of each cube and plot that. To specify a time slice, pass the time slice to -t argument.
For a full list of options, use latviz --help
LatViz supports three output formats,
gif(ImageMagick)avi(ffmpeg)mp4(ffmpeg)
Running
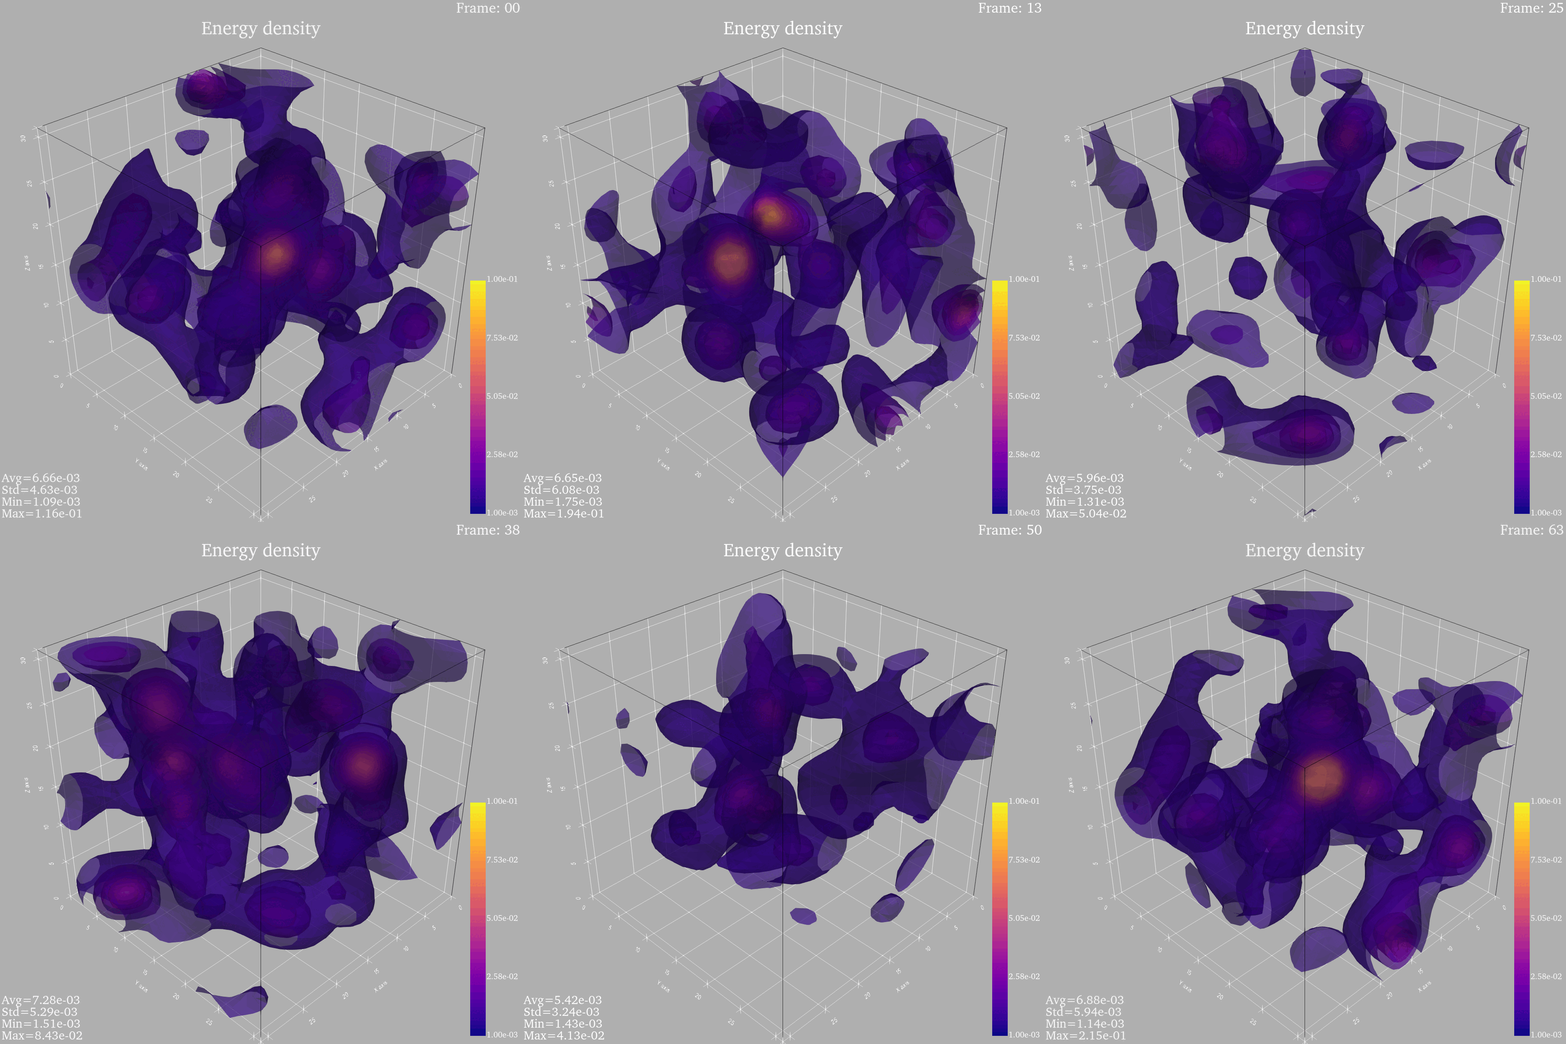
latviz example_data/field_density_b62_b6.200000_N32_NT64_np512_config00800.bin -n 32 -nt 64 -m "Energy density" -c 15 --vmax 0.1 --vmin 0.001 --keep-frames -a gif
for the configuration of the energy density
example_data/field_density_b62_b6.200000_N32_NT64_np512_config00800.bin
produces the figure.
An example using of an animation using a set of enumerated configurations. In this case, the application of gradient flow.
latviz $(ls old_data/example_data/topc | xargs -I % greadlink -f old_data/example_data/topc/%) -n 32 -nt 64 -t 0 -m "Topological Charge" --title "Topological Charge" -c 15 --vmax 0.001 --vmin -0.001 --keep-frames -a gif
Unit testing done by using pytest.
- Allow for more animation configurations(e.g. camera and scene settings), by providing a config file(a .json or .yaml)?
If you encounter any issues, please report them in a issue, detailing run command, system, type of input data, and the stdout.
Likewise, ff you have any suggestions, feel free to make an issue.

