- Move to
frontenddirectory and build docker imagedocker build -t hoangndst/vdt-frontend:latest .
Docker Historydocker history hoangndst/vdt-frontend:latest
- Move to
backenddirectory and build docker imagedocker build -t hoangndst/vdt-backend:latest .
Docker Historydocker history hoangndst/vdt-backend:latest
- Login to docker hub if you have not logged in
docker login
- Push docker images to docker hub
docker push hoangndst/vdt-frontend:latest
docker push hoangndst/vdt-backend:latest
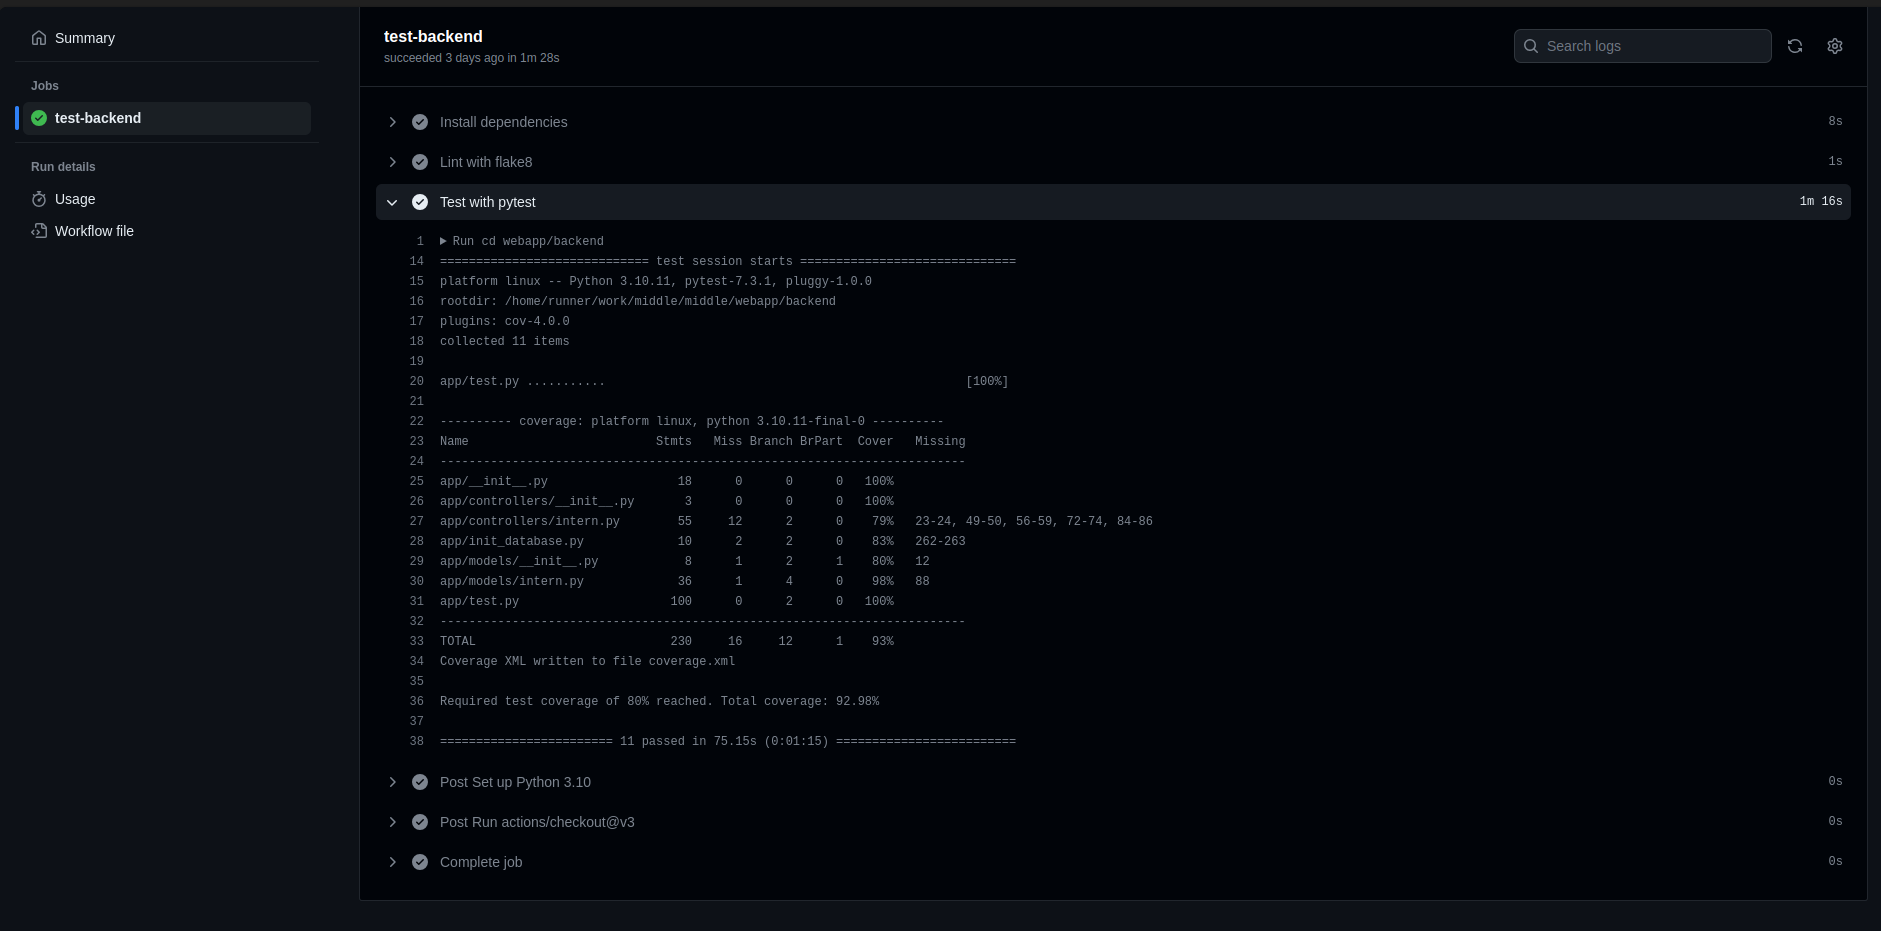
- Using pytest to test backend: test.py
- Deploy test mongo database
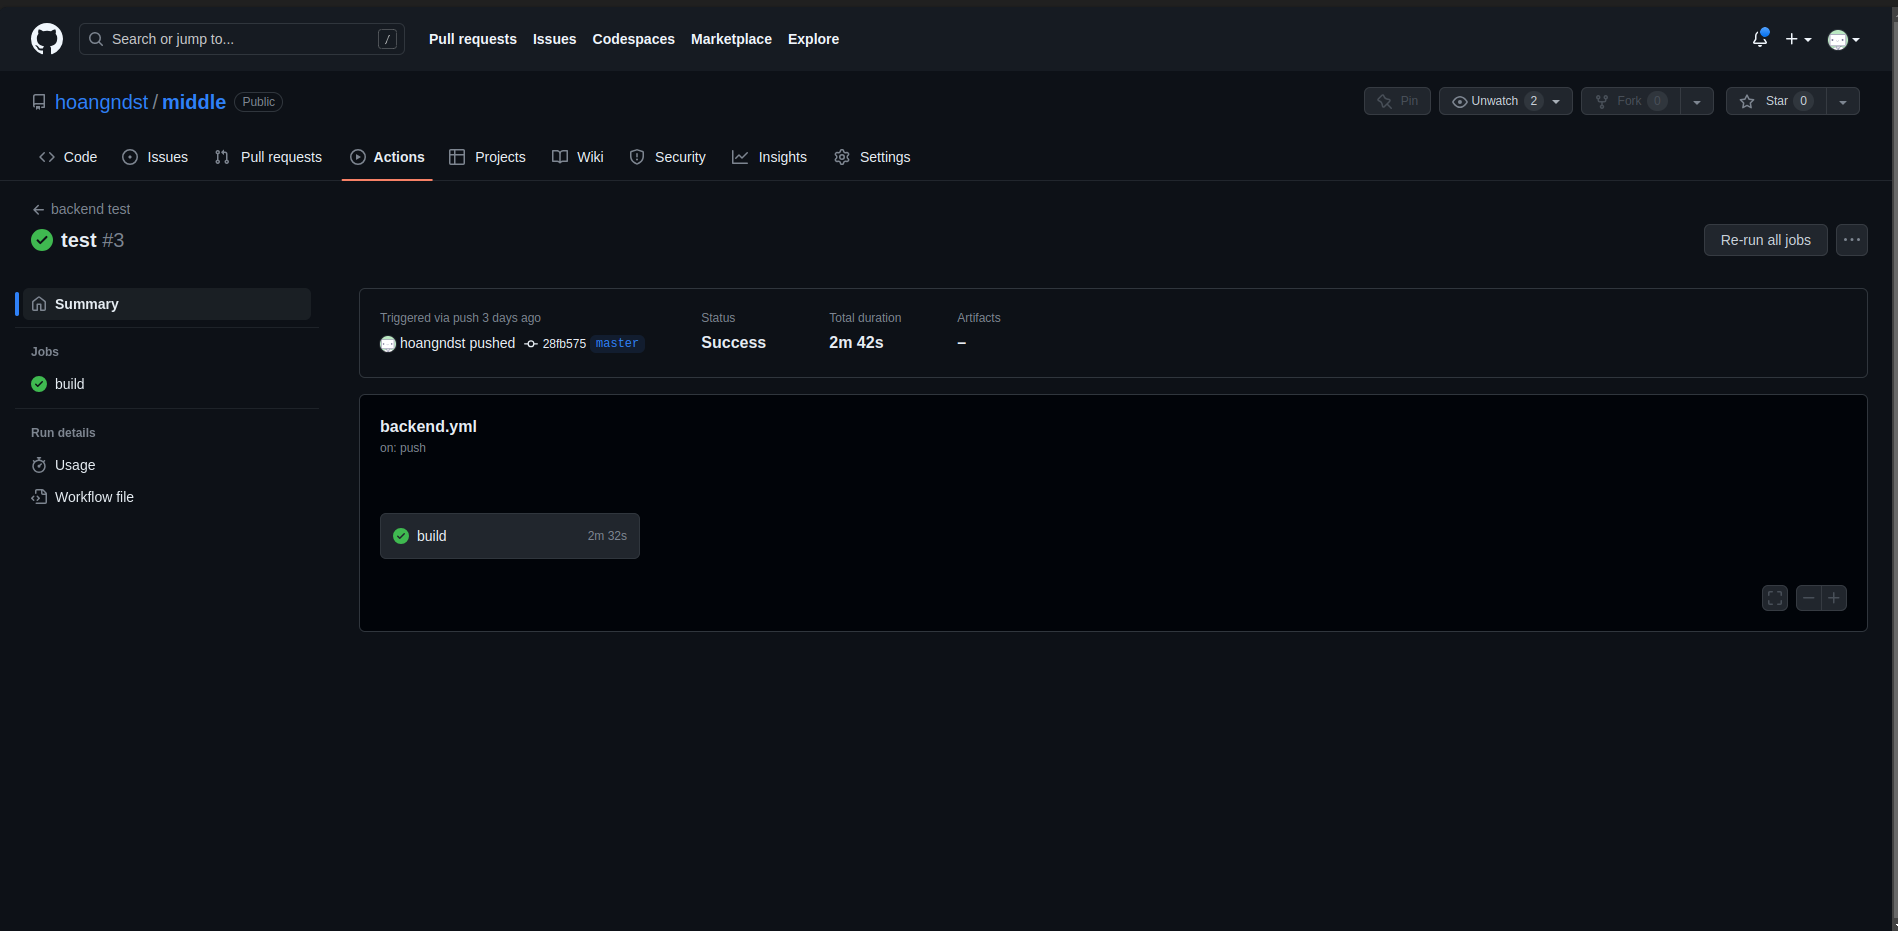
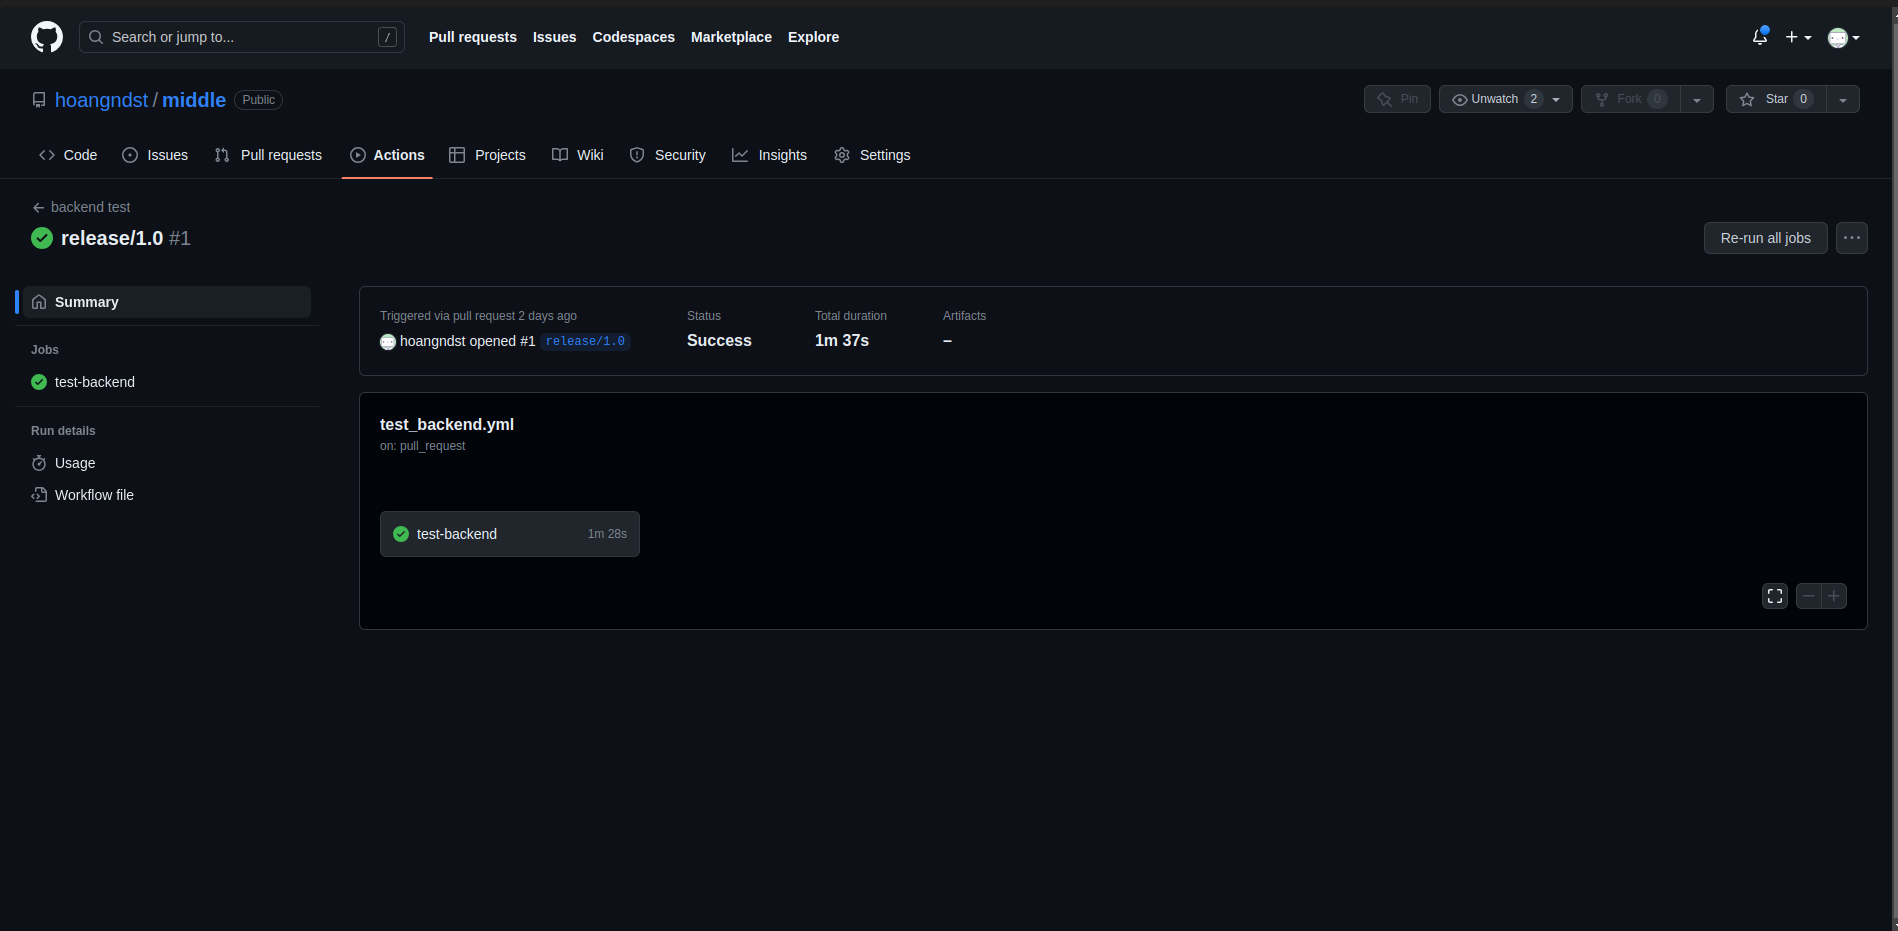
- Setup Github Action Workflow: test_backend.yml
- Run when push to master branch or open pull request
...
on:
push:
  branches: [master]
  paths:
    - "webapp/backend/**"
pull_request:
  branches: [master]
  paths:
    - "webapp/backend/**"
...
- Setup Github Action Workflow: ci_backend.yml
- Config run when has new release with format
release/v*... push: tags: - release/v* ...
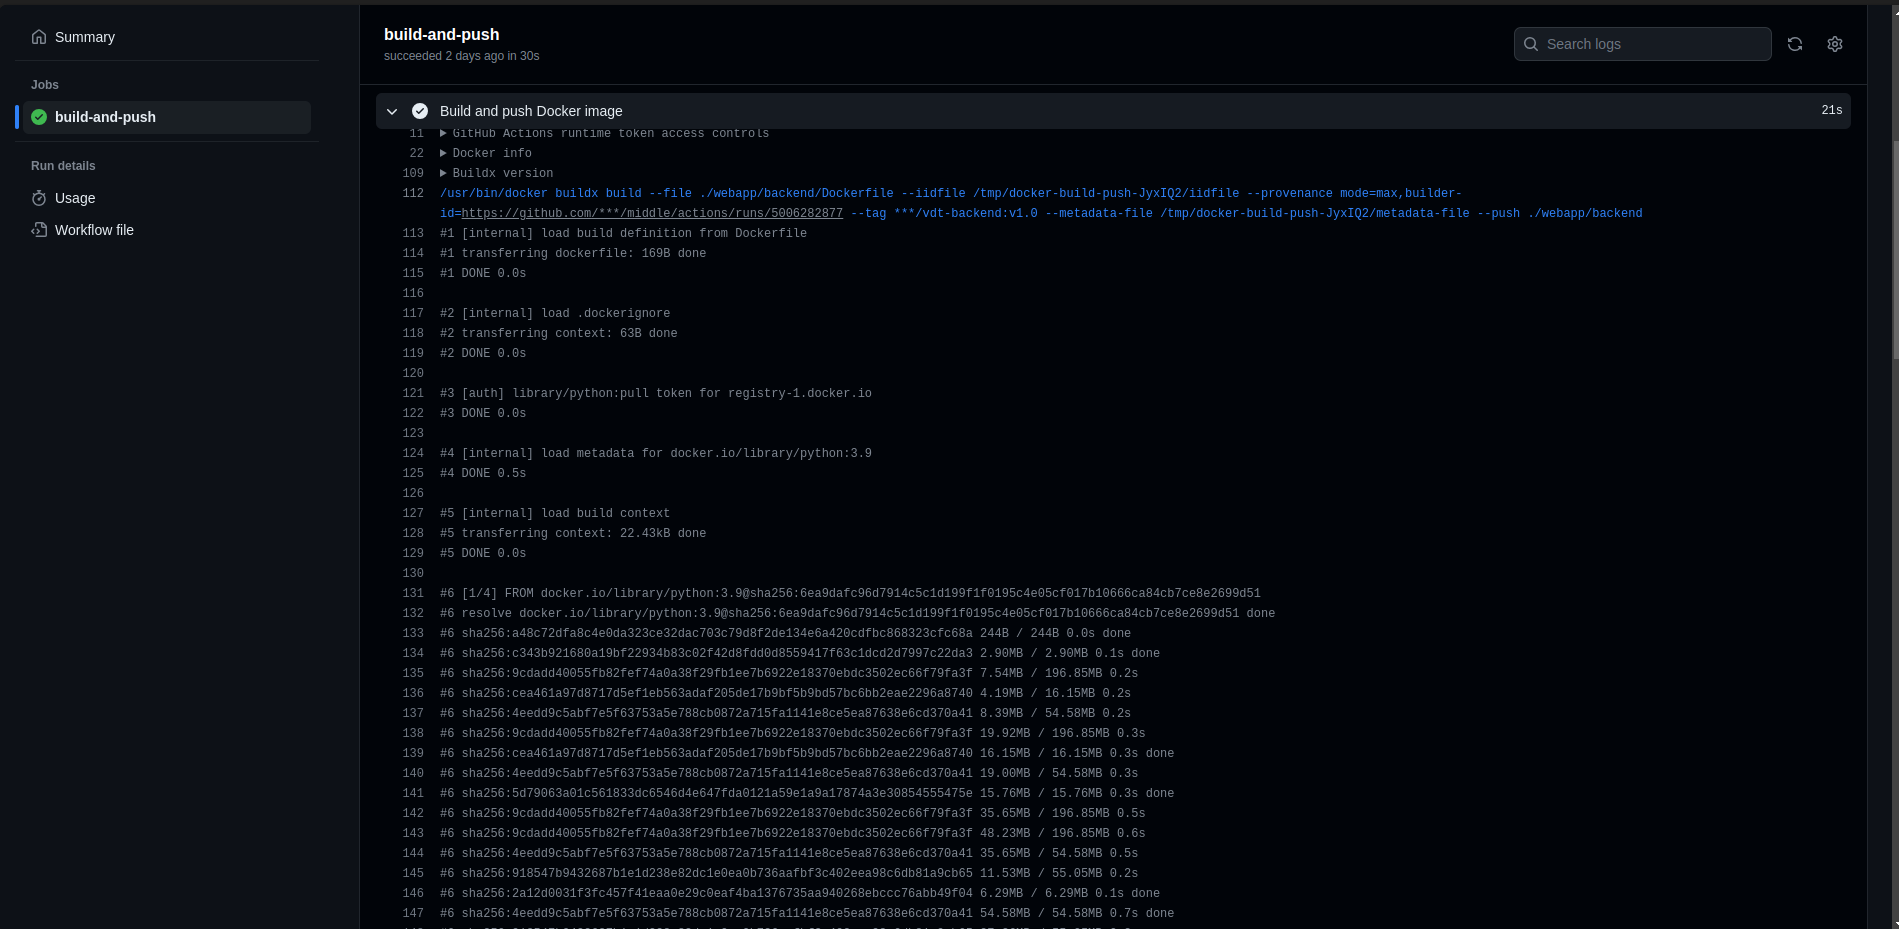
- Auto build docker image and push to docker hub
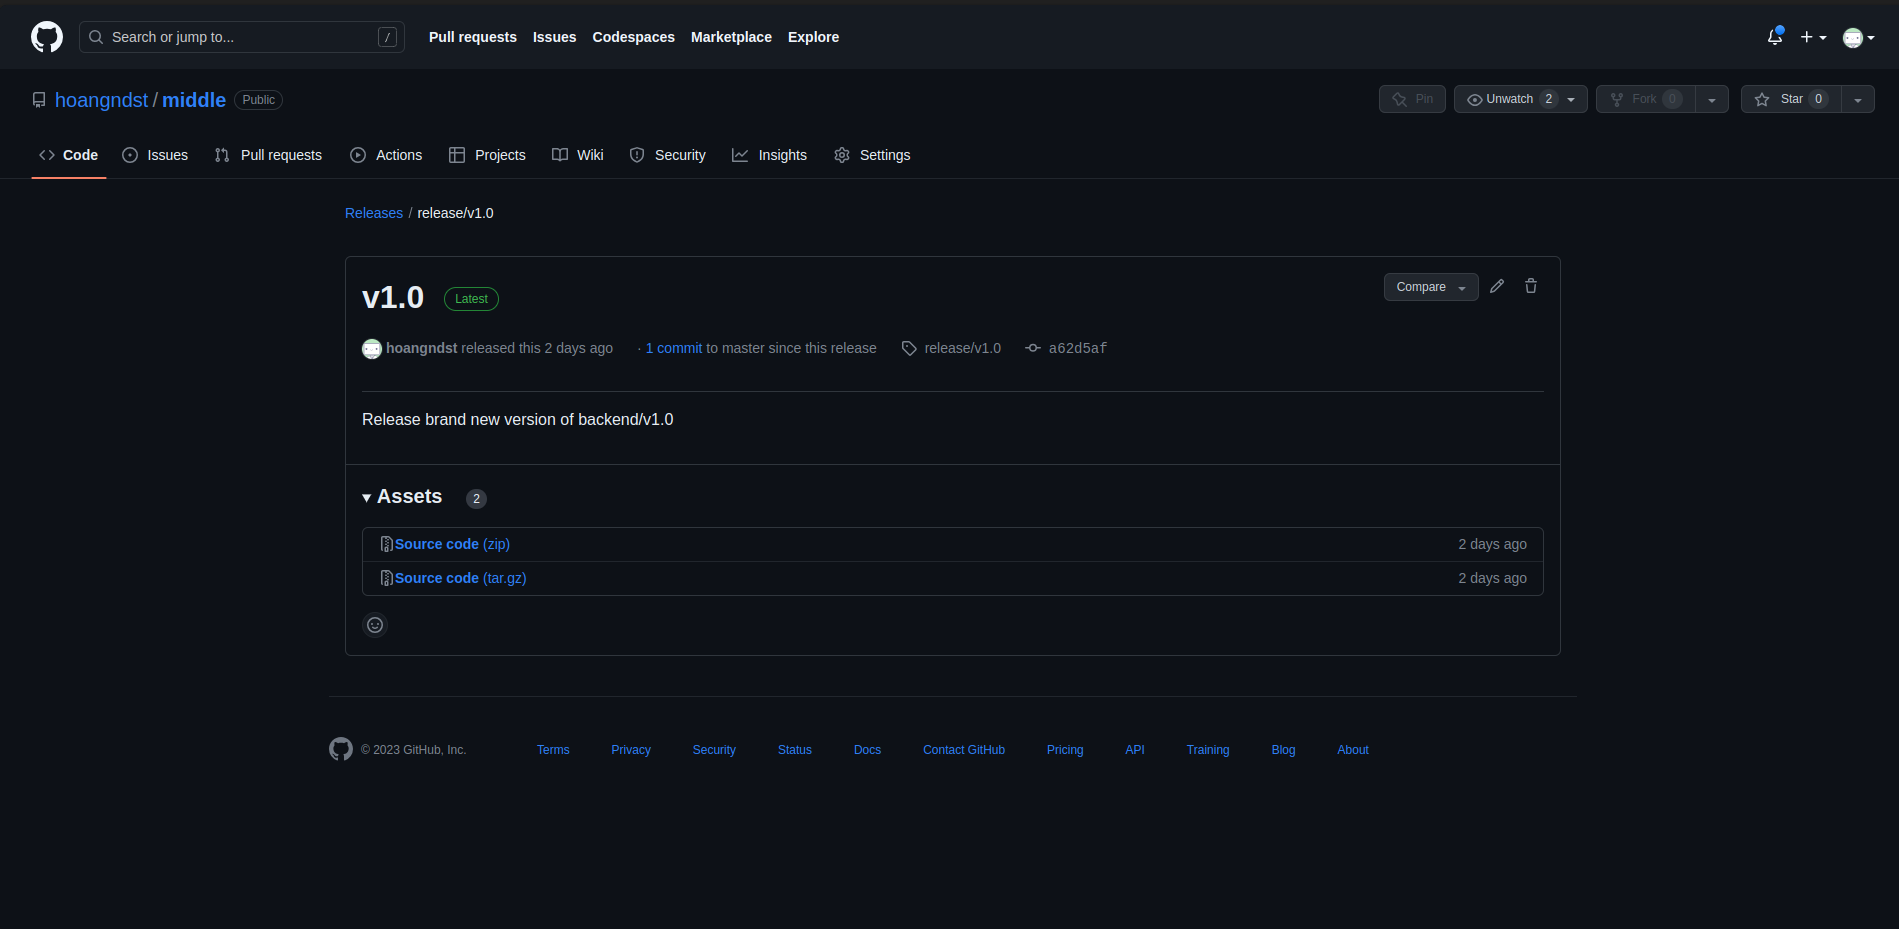
- Create new
tag/release - Auto Build and Push to Docker Hub
- Overview
We will use 10GB disk to create NFS server for sharing data between containers.
/dev/sda - Install
nfs-kernel-serverpackagesudo apt update sudo apt install nfs-kernel-server
- Create directory for sharing data
sudo mkdir -p /mnt/nfs_volume/docker_nfs_share
- Change ownership of the directory to nobody user
sudo chown nobody:nogroup /mnt/nfs_volume/docker_nfs_share
- Export the directory
Add the following line to the file
sudo vi /etc/exports
/mnt/nfs_volume/docker_nfs_share *(rw,sync,no_subtree_check,no_root_squash,no_all_squash,insecure)rw: Allow both read and write requests on the NFS volume.sync: Reply to requests only after the changes have been committed to stable storage.no_subtree_check: Disable subtree checking. When a shared directory is the subdirectory of a larger file system, nfs performs scans of every directory above it, in order to verify its permissions and details. Disabling the subtree check may increase the reliability of NFS, but reduce security.no_root_squash: Enable root squashing. This prevents root users connected remotely from having root privileges and assigns them the user ID for the user nfsnobody.no_all_squash: Enable all squashing. This option is the converse of no_root_squash and makes root users on the client machine appear as root users on the NFS server. This option is generally used for diskless clients.insecure: This option allows the NFS server to respond to requests from unprivileged ports (ports greater than 1024). This option is useful for mounting NFS volumes from older clients such as NFS version 3.
- Restart the NFS server
sudo systemctl restart nfs-kernel-server
- Infrastructure
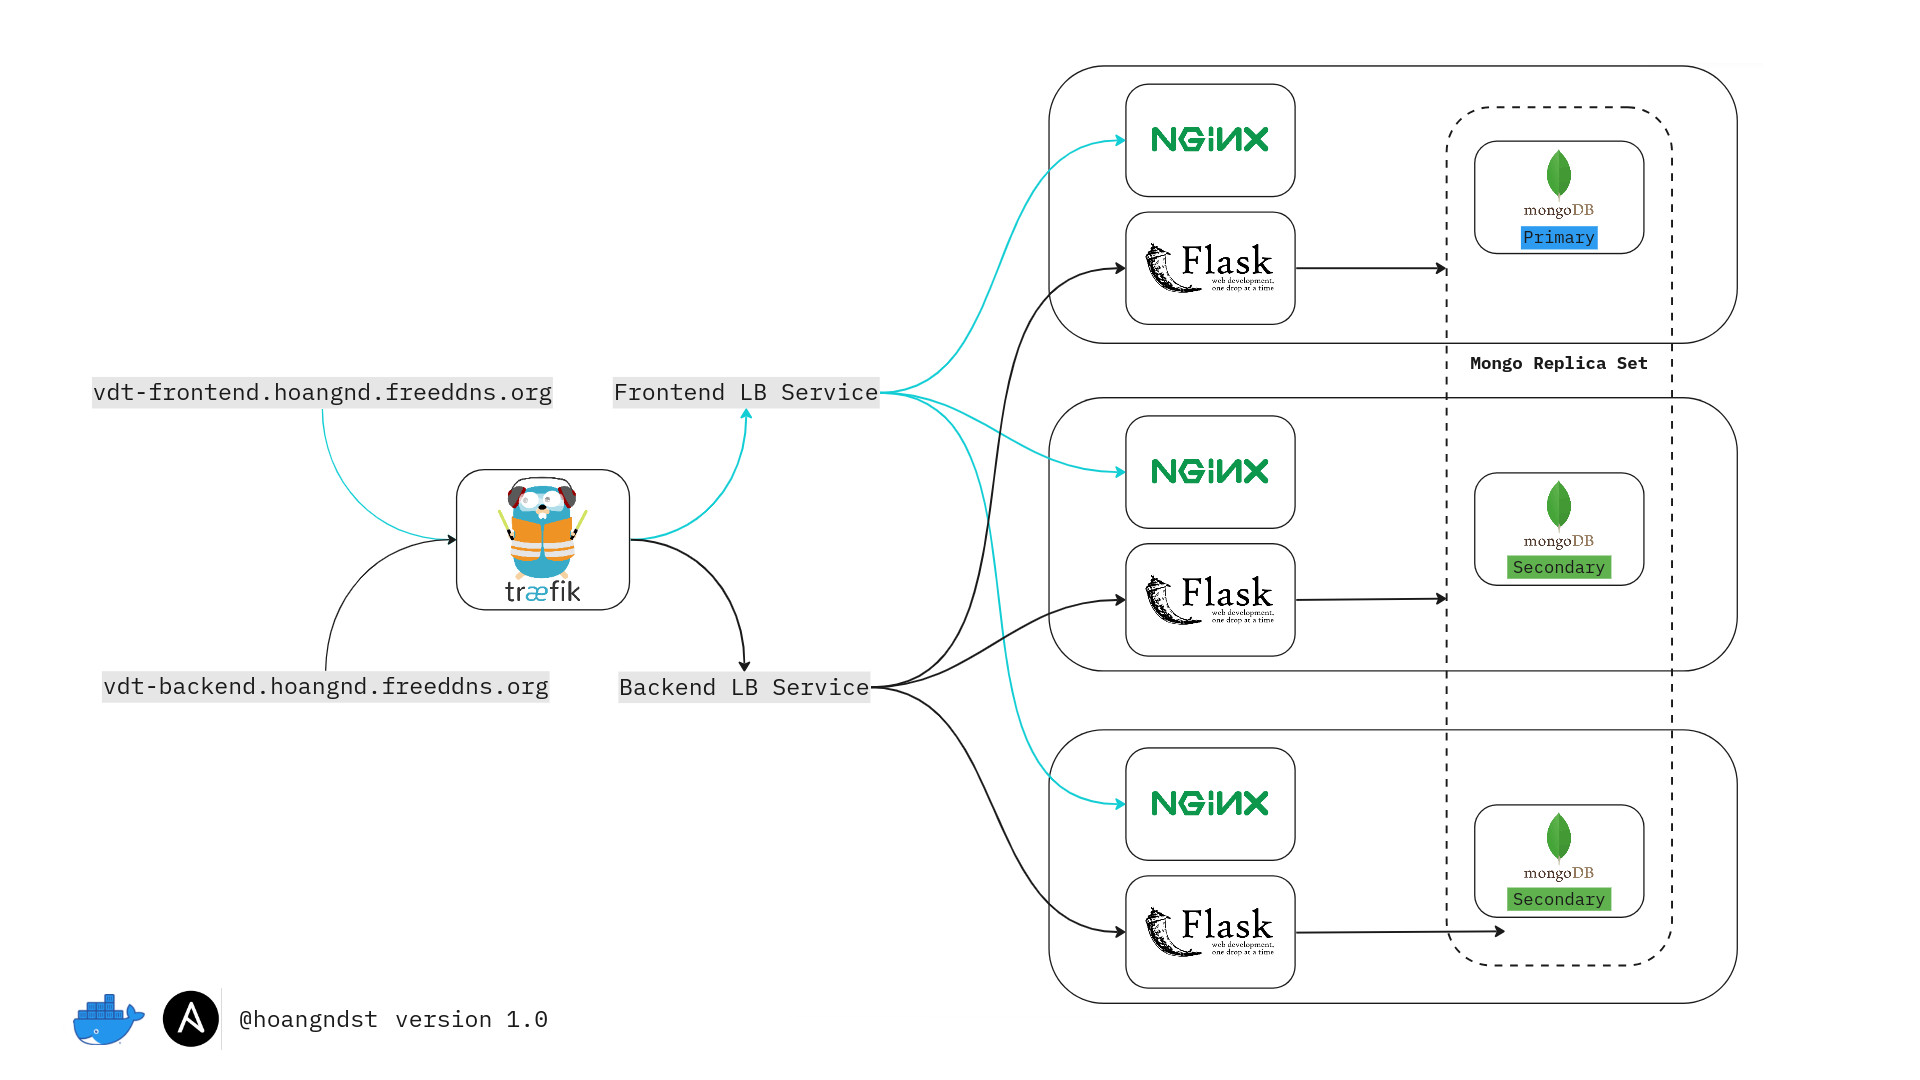
Digital Ocean: We will use Digital Ocean to create 3 droplets for our project.VM1: This droplet will be used to deploy application and act as NFS server.VM2: This droplet will be used to deploy application.VM3: This droplet will be used to deploy application.
- Technologies
-
Ansible: We will use Ansible to provision and deploy application to our droplets. -
Docker: We will use Docker to containerize our application. -
NFS: We will use NFS to share data between containers. -
Traefik: We will use Traefik as a reverse proxy and load balancer for our application. -
A replica set in MongoDB is a group of mongod processes that maintain the same data set. Replica sets provide redundancy and high availability, and are the basis for all production deployments. This section introduces replication in MongoDB as well as the components and architecture of replica sets. The section also provides tutorials for common tasks related to replica sets.MongDB Replica Set: We will use MongoDB Replica Set to store data of our application. -
Nginx: We will use Nginx as web server for our application. -
Flask: We will use Flask as backend framework for our application.
- Move to
ansibledirectory - Setup docker for your target environments in role
common
- Tasks:
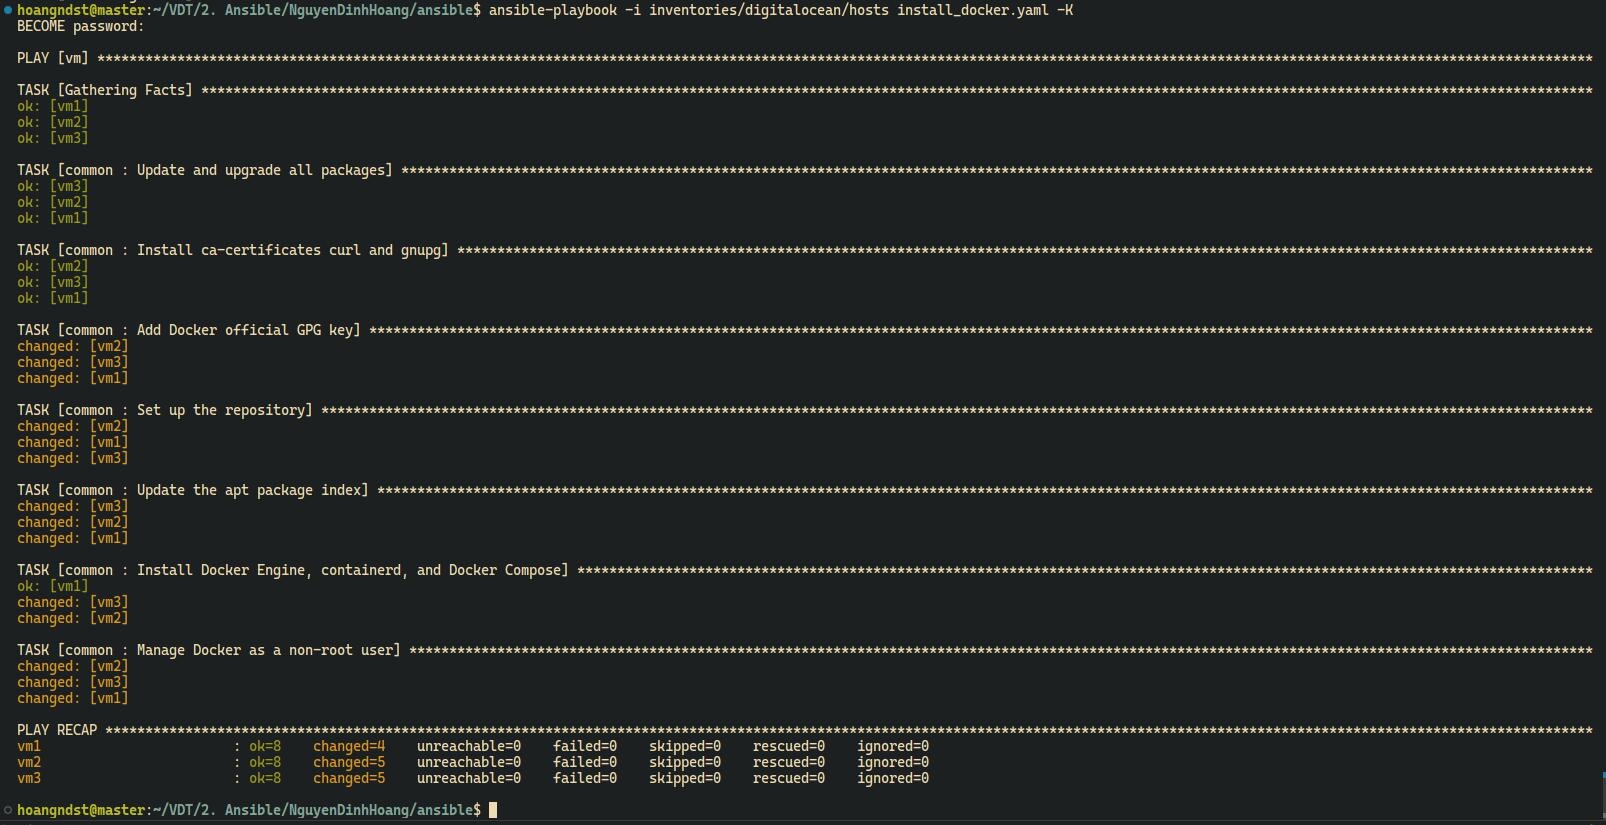
repository.yaml: Add docker repository to apt source listdocker.yaml: Install Docker Engine, containerd, and Docker Composemain.yaml: Include all tasks
- Ansible:
Type your sudo password when prompted
ansible-playbook -i inventories/digitalocean/hosts install_docker.yaml -K
- Deploy MongoDB Replica Set
- Default variables:
main.yaml: Default variables for MongoDB Replica Set
- Tasks:
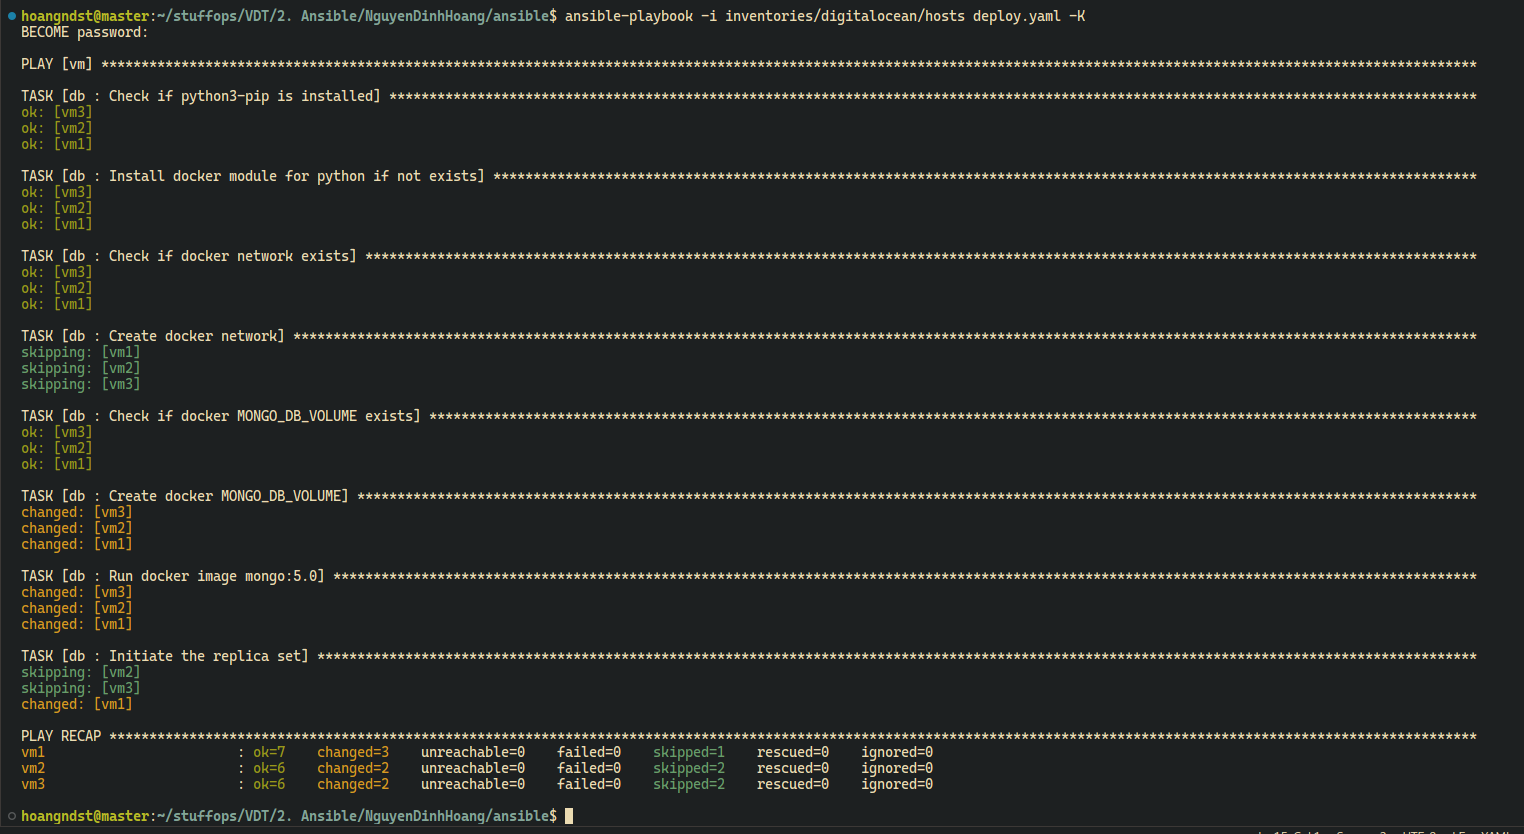
setup.yaml: Setup required docker models for ansible, create docker network, volume if not exists.deploy.yaml: Deploy MongoDBinit.yaml: Initiate MongoDB Replica Setmain.yaml: Include all tasks
- Ansible:
Type your sudo password when prompted
ansible-playbook -i inventories/digitalocean/hosts deploy.yaml -K
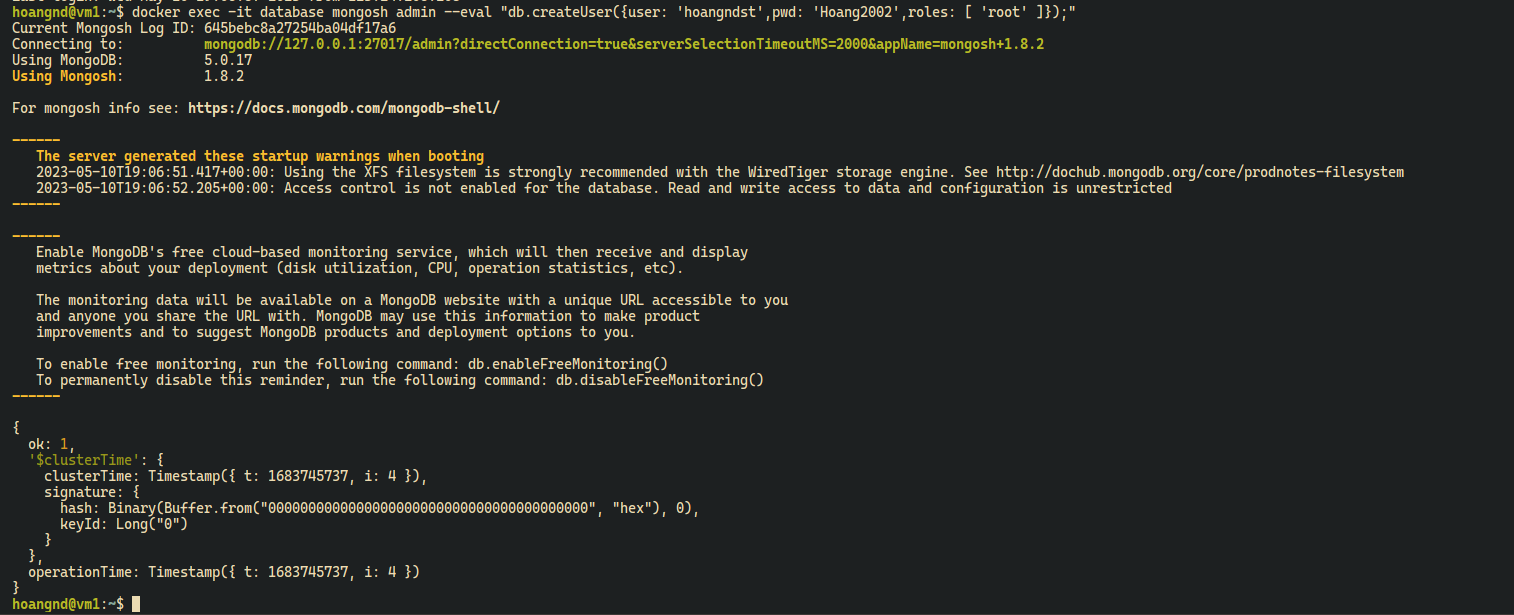
- Init MongoDB root user on Primary node
docker exec -it database mongosh admin --eval "db.createUser({user: 'hoangndst', pwd: 'Hoang2002',roles: [ 'root' ]});"
- For backend connect to MongoDB Replica Set:
modelsclient = MongoClient( host=[Config.MONGO_HOST1, Config.MONGO_HOST2, Config.MONGO_HOST3], replicaset=Config.MONGO_REPLICASET, port=Config.MONGO_PORT, username=Config.MONGO_USERNAME, password=Config.MONGO_PASSWORD, )
- Show config, status of MongoDB Replica Set
It should look like this:
docker exec -it database mongosh admin --eval "rs.conf();"
docker exec -it database mongosh admin --eval "rs.status();"
set: 'mongo-rs',
date: ISODate("2023-05-11T06:23:04.502Z"),
myState: 2,
term: Long("2"),
syncSourceHost: '10.114.0.4:27017',
...
members: [
  {
    _id: 0,
    name: '10.114.0.2:27017',
    health: 1,
    state: 2,
    stateStr: 'SECONDARY',
    uptime: 321,
    ...
  },
  {
    _id: 1,
    name: '10.114.0.3:27017',
    health: 1,
    state: 1,
    stateStr: 'PRIMARY',
    uptime: 319,
    ...
  },
  {
    _id: 2,
    name: '10.114.0.4:27017',
    health: 1,
    state: 2,
    stateStr: 'SECONDARY',
    uptime: 319,
    ...
  }
],
ok: 1,
'$clusterTime': {
  clusterTime: Timestamp({ t: 1683786175, i: 1 }),
  signature: {
    hash: Binary(Buffer.from("0000000000000000000000000000000000000000", "hex"), 0),
    keyId: Long("0")
  }
},
operationTime: Timestamp({ t: 1683786175, i: 1 })
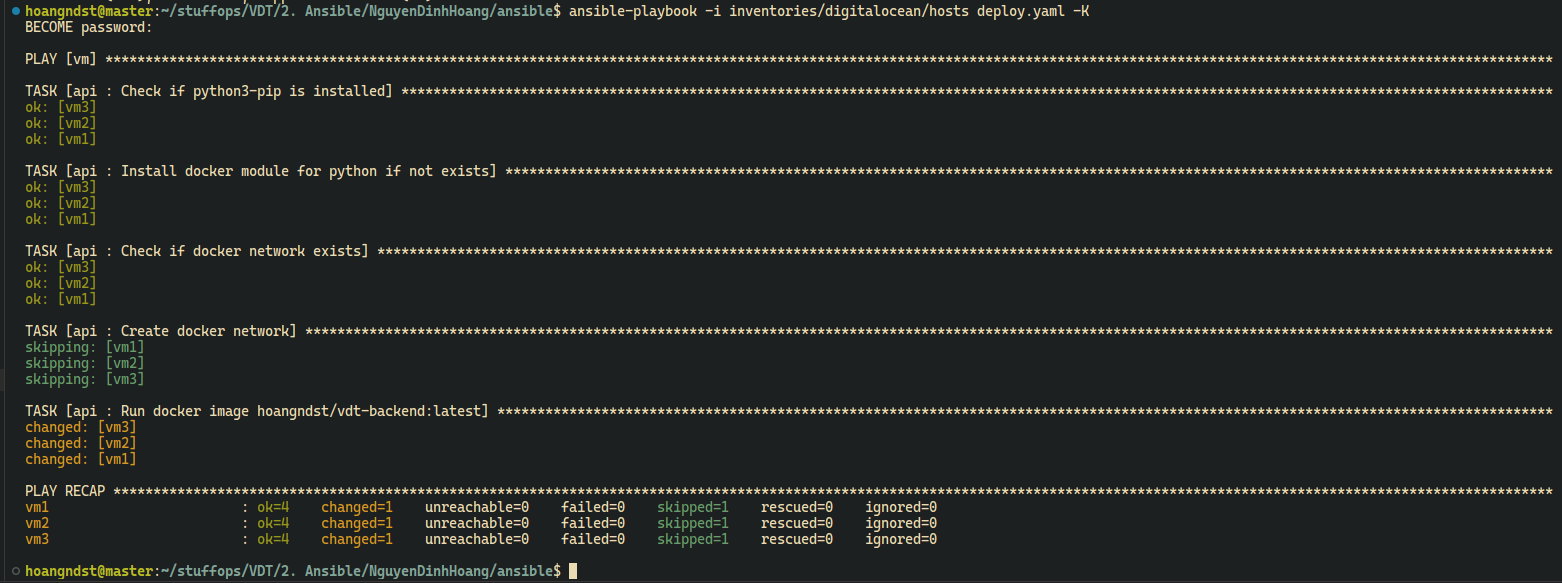
- Deploy API
- Default variables:
main.yaml: Default variables for APINETWORK_NAME: Name of docker networkMONGO_HOST1,MONGO_HOST2,MONGO_HOST3: IP address of MongoDB Replica SetMONGO_REPLICASET: Mongo Replica Set nameMONGO_PORT: MongoDB portMONGO_USERNAME: MongoDB usernameMONGO_PASSWORD: MongoDB password
- Tasks:
setup.yaml: Setup required docker models for ansible, create docker network if not exists.deploy.yaml: Deploy APImain.yaml: Include all tasks
- Ansible:
Type your sudo password when prompted
ansible-playbook -i inventories/digitalocean/hosts deploy.yaml -K
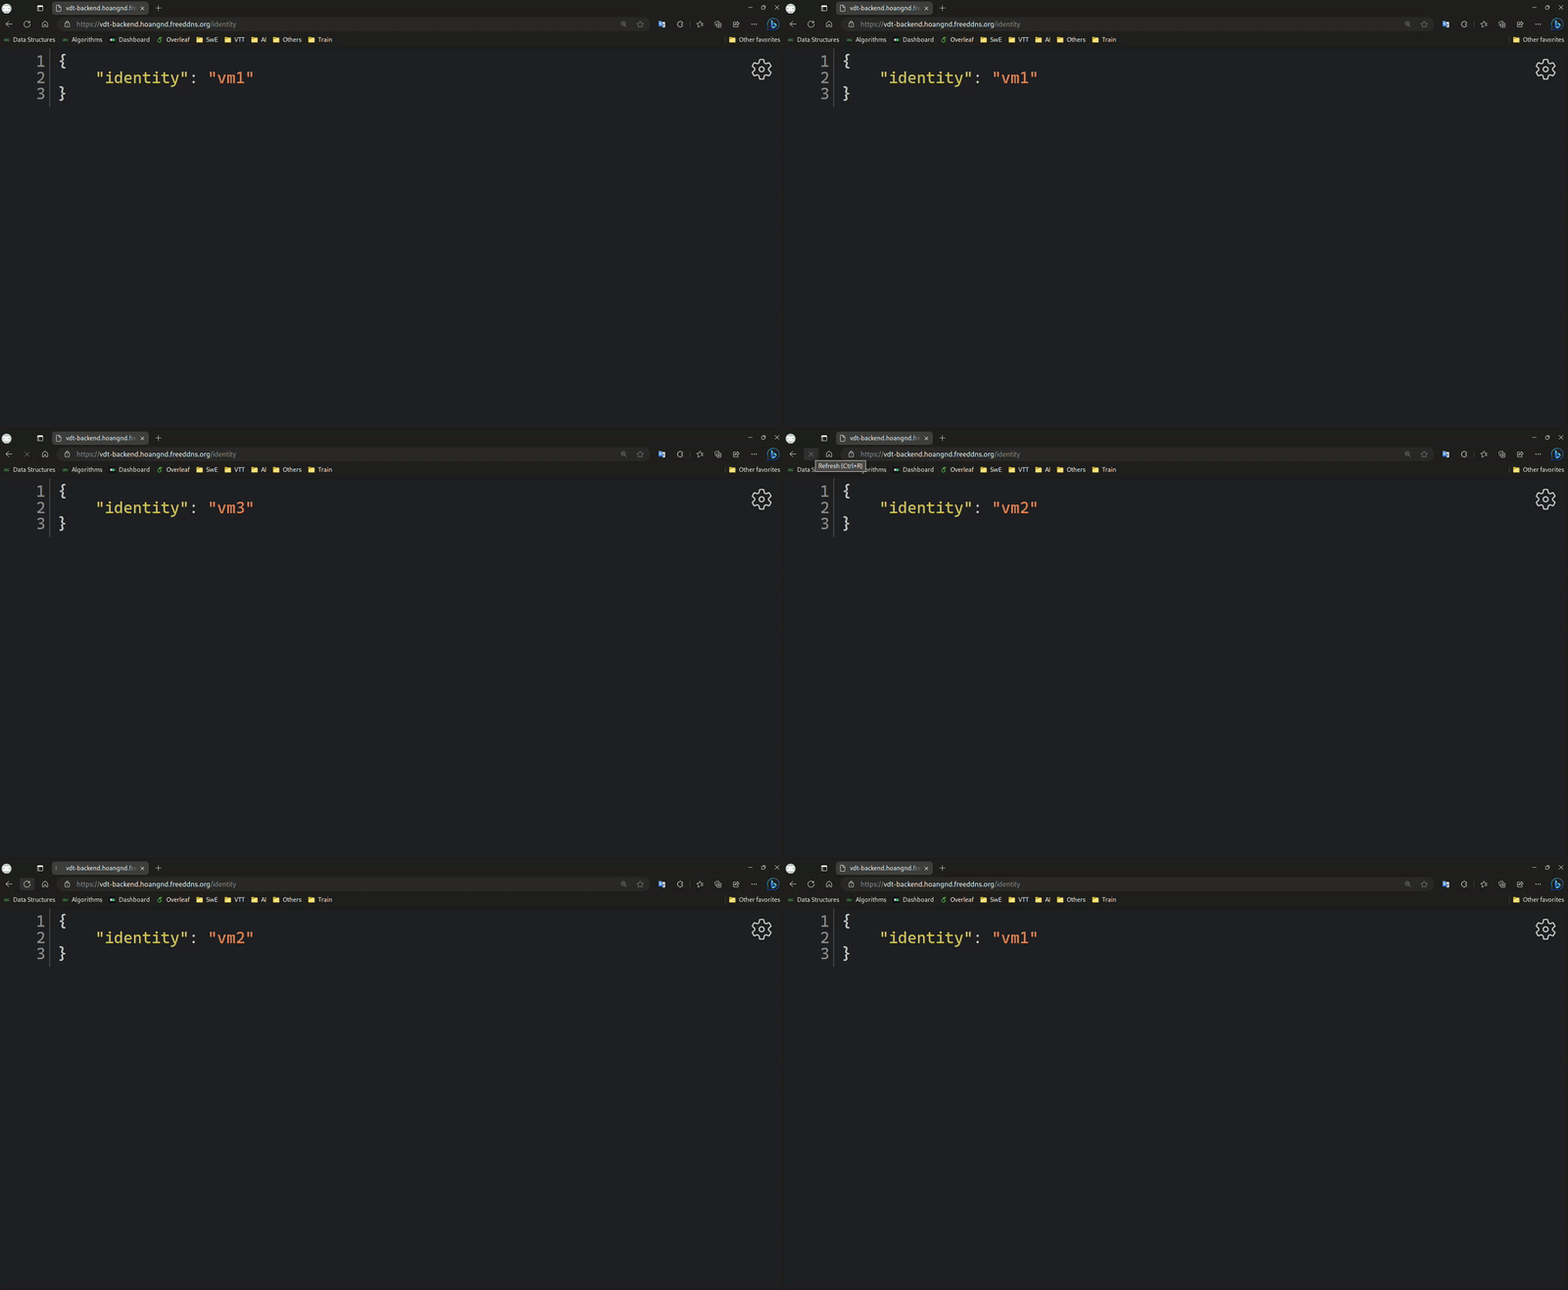
- Backend URL:
https://vdt-backend.hoangnd.freeddns.org
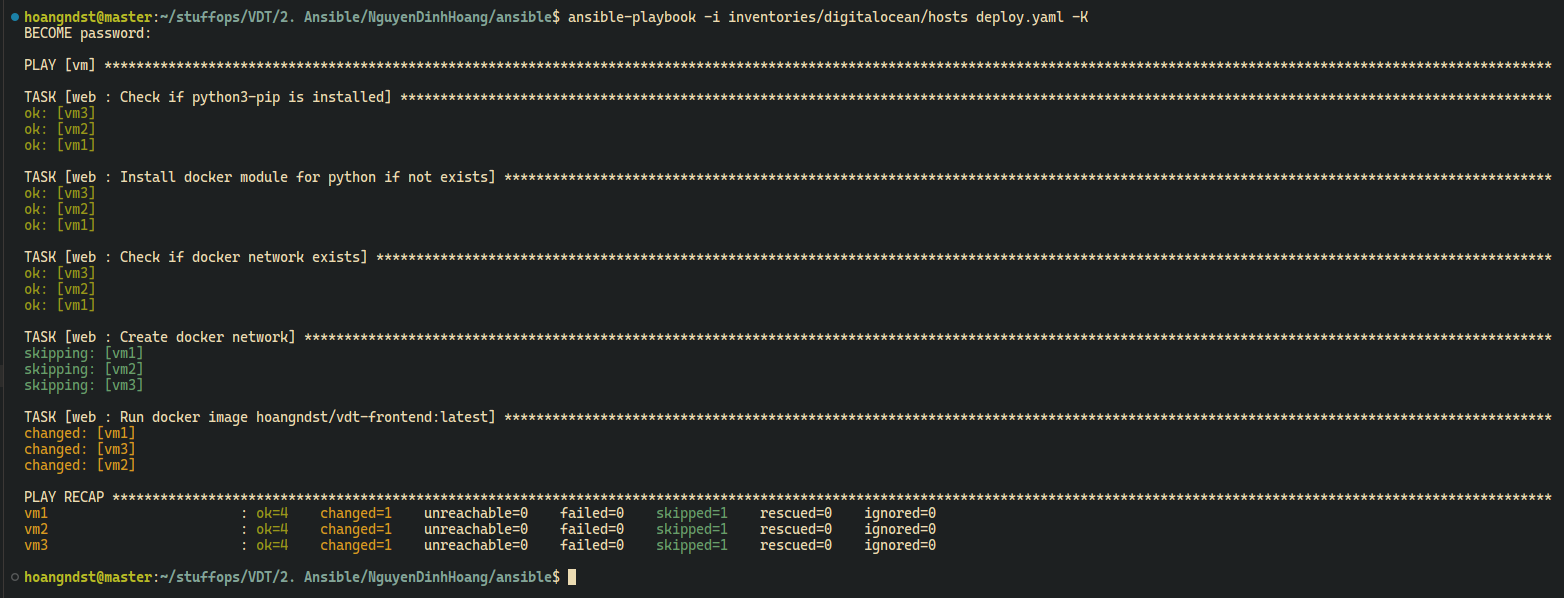
- Deploy web
- Default variables:
main.yaml: Default variables for webNETWORK_NAME: Name of docker network
- Tasks:
setup.yaml: Setup required docker models for ansible, create docker network if not exists.deploy.yaml: Deploy webmain.yaml: Include all tasks
- Ansible:
Type your sudo password when prompted
ansible-playbook -i inventories/digitalocean/hosts deploy.yaml -K
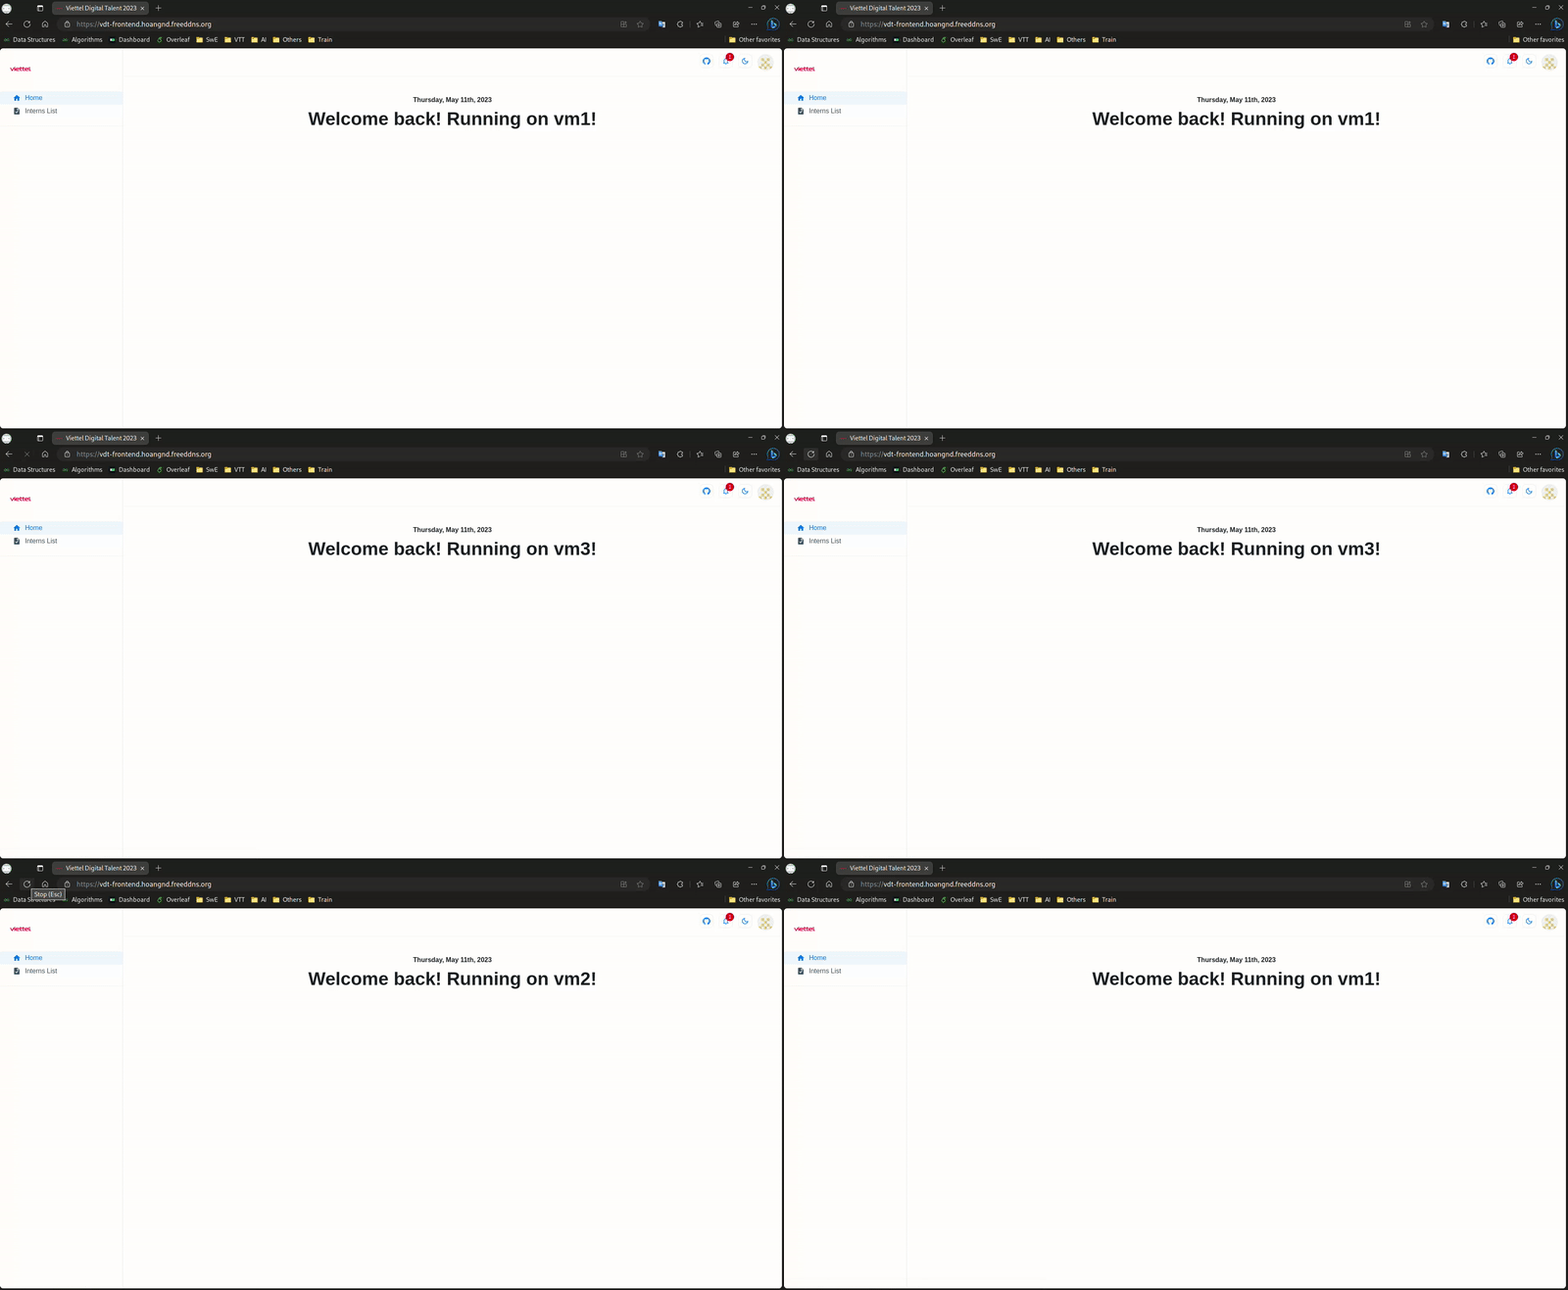
- Frontend URL:
https://vdt-frontend.hoangnd.freeddns.org
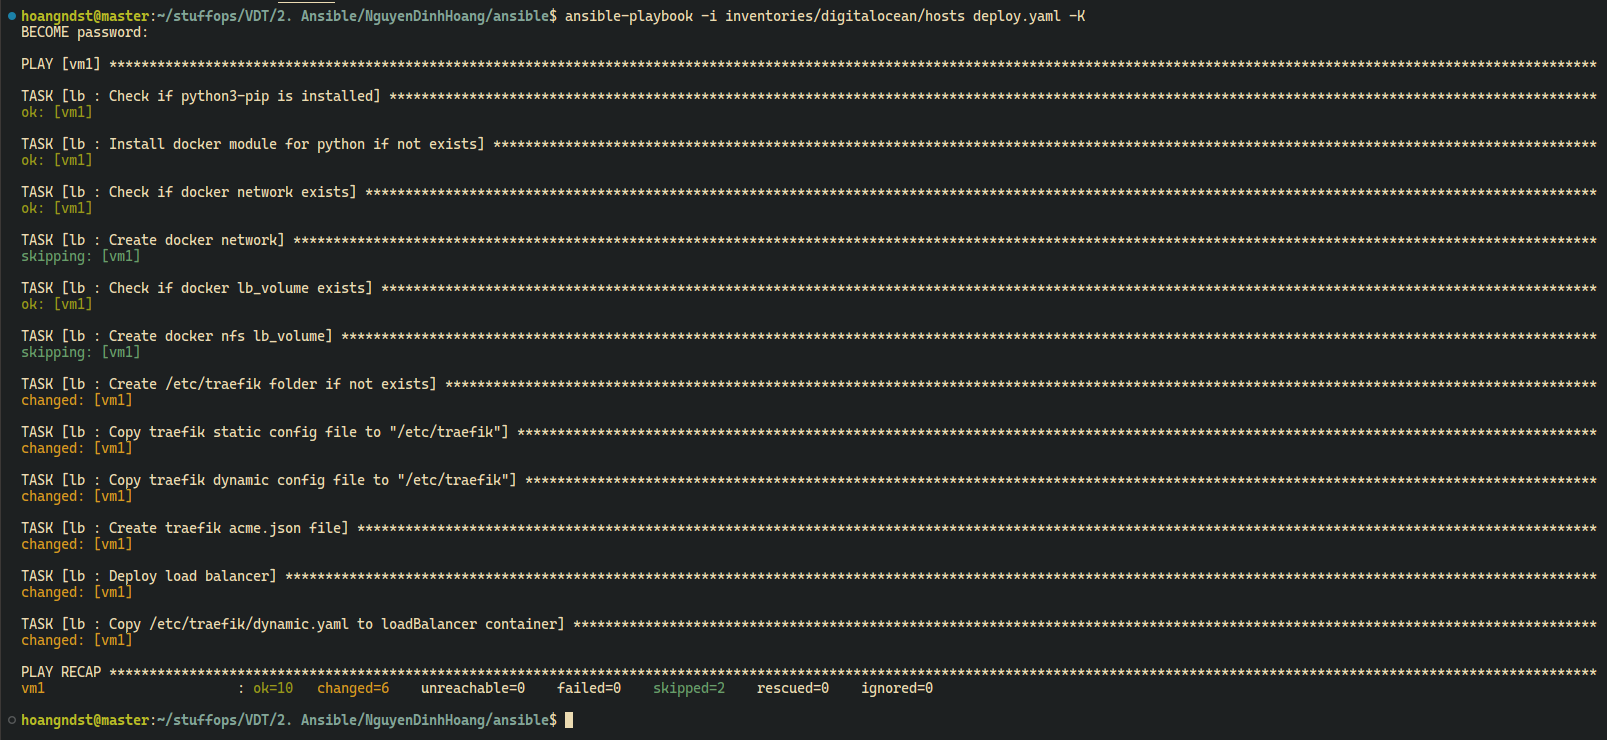
- Deploy Traefik
-
Default variables:
main.yaml: Default variables for TraefikNETWORK_NAME: Name of docker networkLB_VOLUME: Volume name of TraefikNFS_SERVER_IP: IP address of NFS serverNFS_SHARE_PATH: Path of NFS share folderMAIN_DOMAIN: Your main domainFRONTEND_DOMAIN: Your frontend domain (subdomain)BACKEND_DOMAIN: Your backend domain (subdomain)TRAEFIK_DOMAIN: Your Traefik domain (subdomain)VM1_IP: IP address of VM1VM2_IP: IP address of VM2VM3_IP: IP address of VM3DYNU_API_KEY: Your dns provider API key (This depends on your dns provider:Traefik DNS providers docs)EMAIL: Your email
-
Templates:
-
traefik.yaml.j2: Traefik static configuration -
dynamic.yaml.j2: Traefik dynamic configurationSet up Load Balancer service
...
services:
vdt-frontend:
  loadBalancer:
    healthCheck:
      path: /
      port: 3000
    servers:
      - url: http://{{ VM1_IP }}:3000
      - url: http://{{ VM2_IP }}:3000
      - url: http://{{ VM3_IP }}:3000
vdt-backend:
  loadBalancer:
    healthCheck:
      path: /test
      port: 5000
    servers:
      - url: http://{{ VM1_IP }}:5000
      - url: http://{{ VM2_IP }}:5000
      - url: http://{{ VM3_IP }}:5000
-
-
Tasks:
setup.yaml: Setup required docker models for ansible, create docker network if not exists. Copy Traefik configuration files to NFS share folder. This is preparation step for clustering Traefik.deploy.yaml: Deploy Traefikmain.yaml: Include all tasks
-
Ansible:
ansible-playbook -i inventories/digitalocean/hosts deploy.yaml -K
Type your sudo password when prompted
-
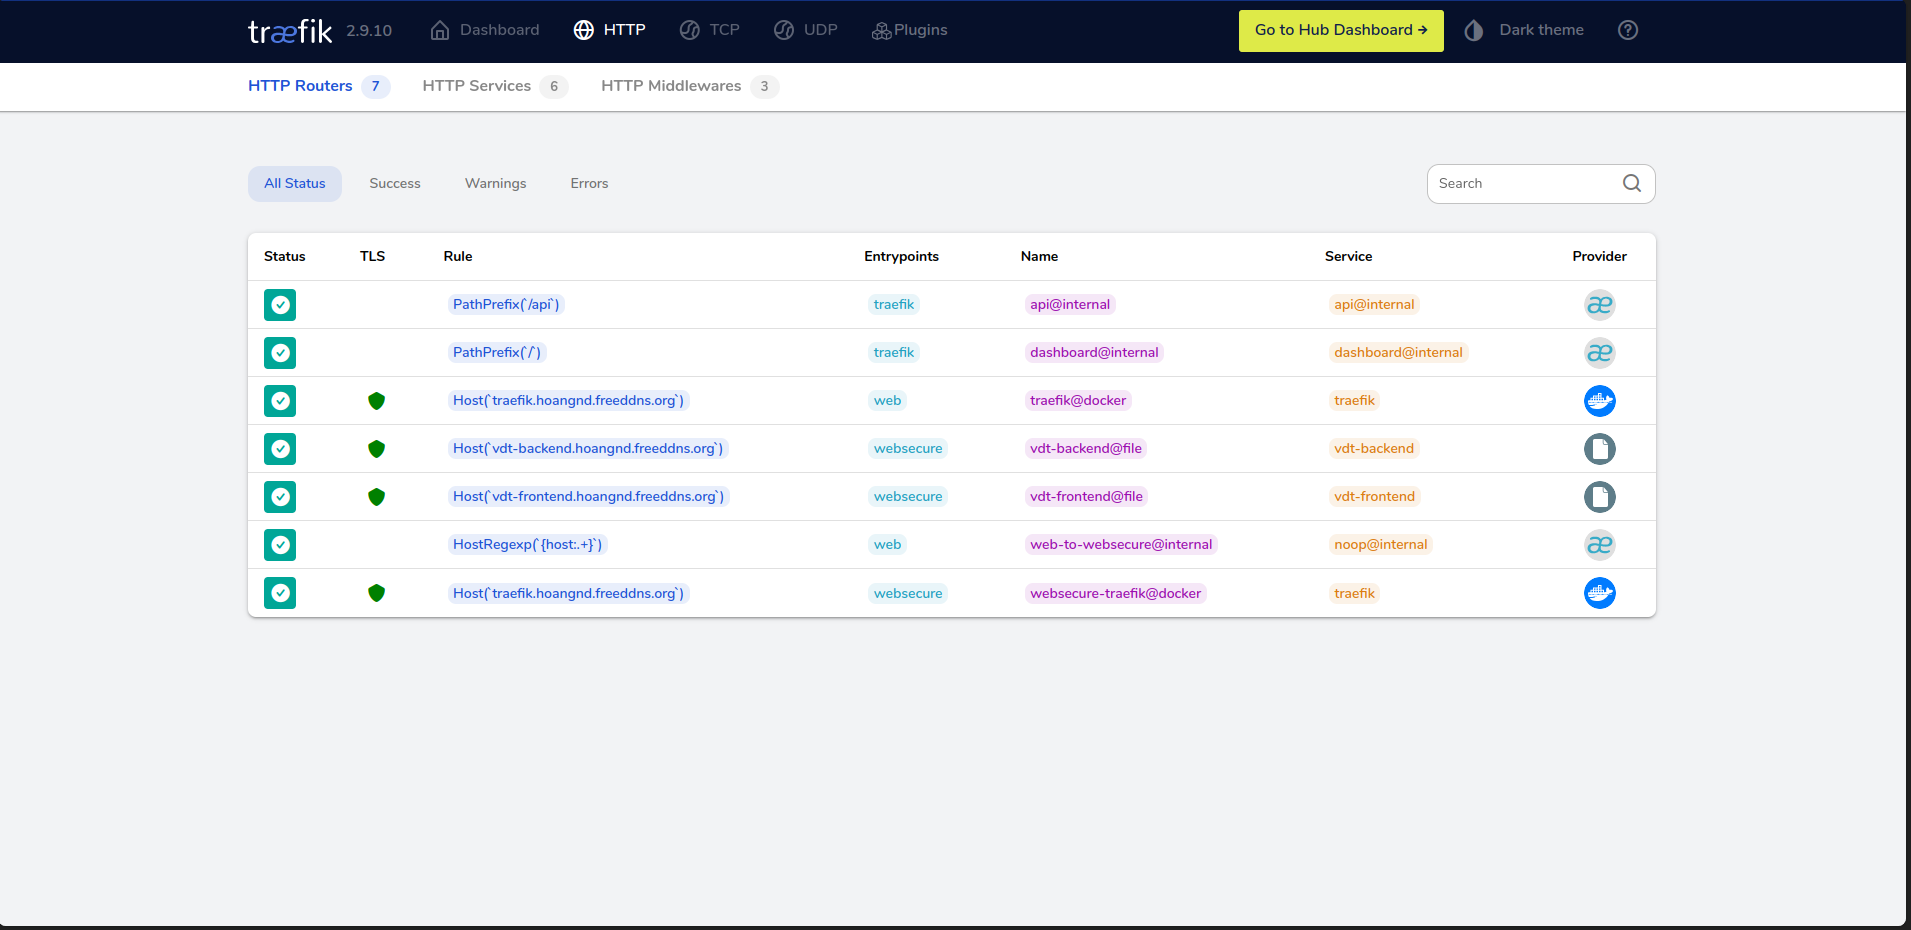
Traefik Dashboard:
https://traefik.hoangnd.freeddns.org -
Frontend Load Balancer:
-
Backend Load Balancer:
-
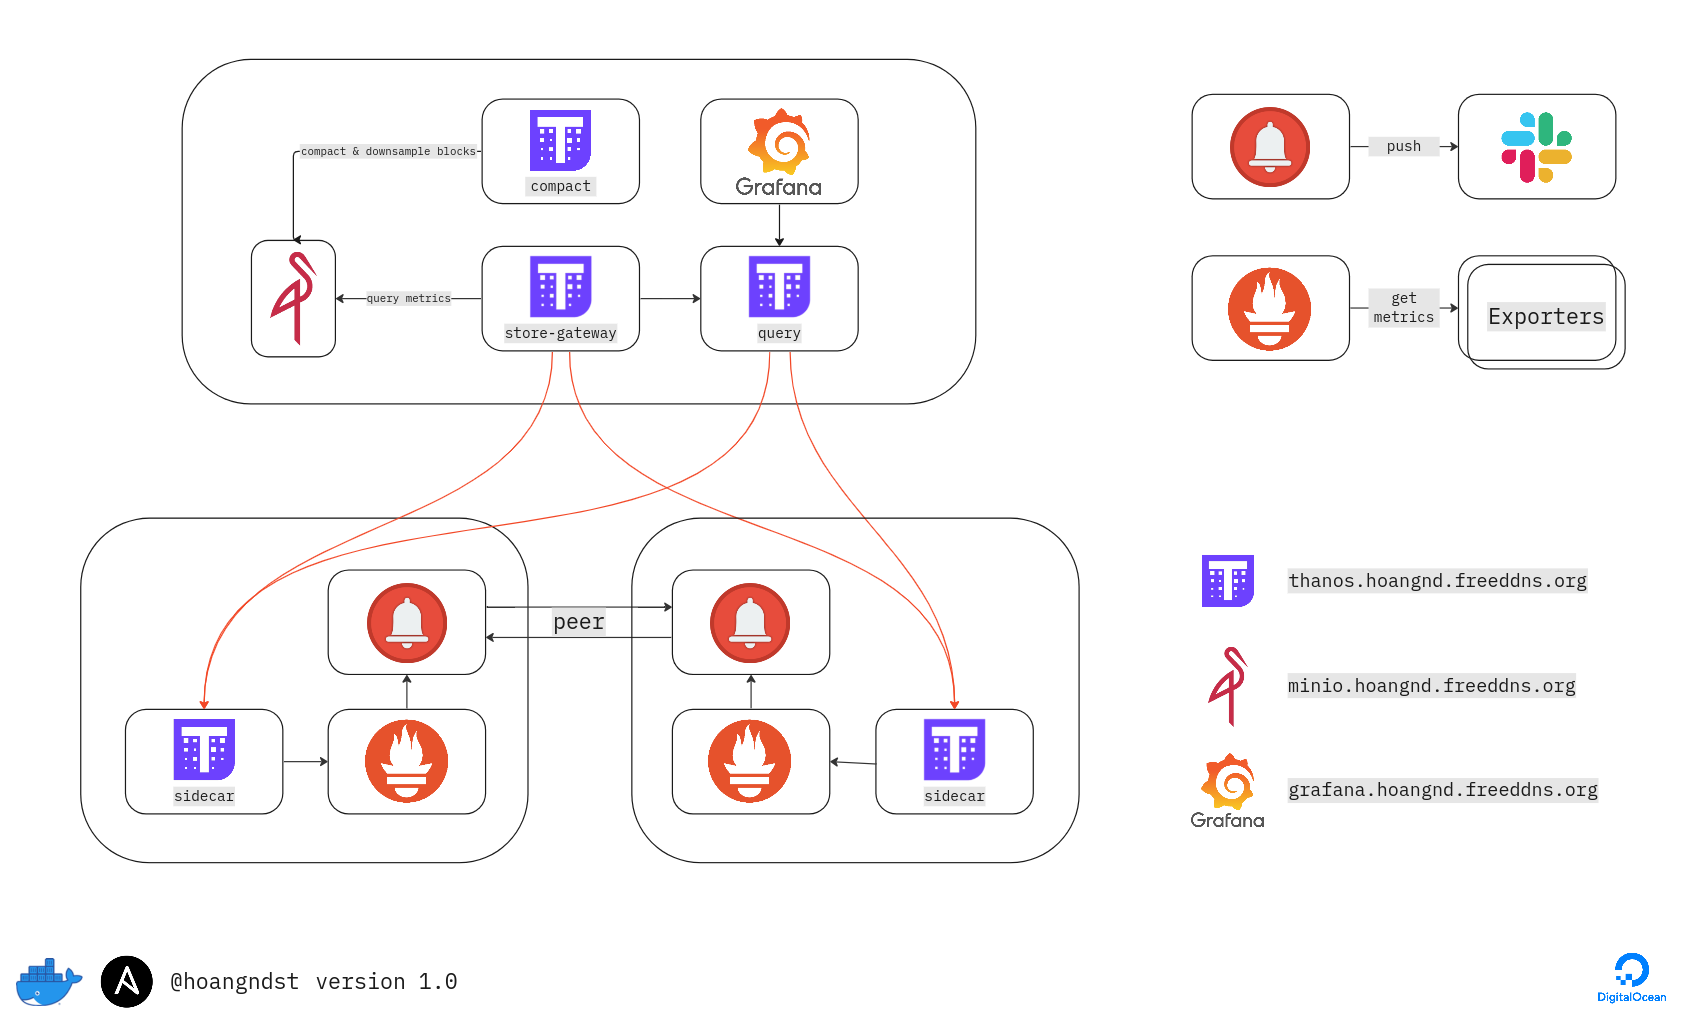
Prometheus: Collect metrics from targets by scraping metrics HTTP endpoints on these targets. -
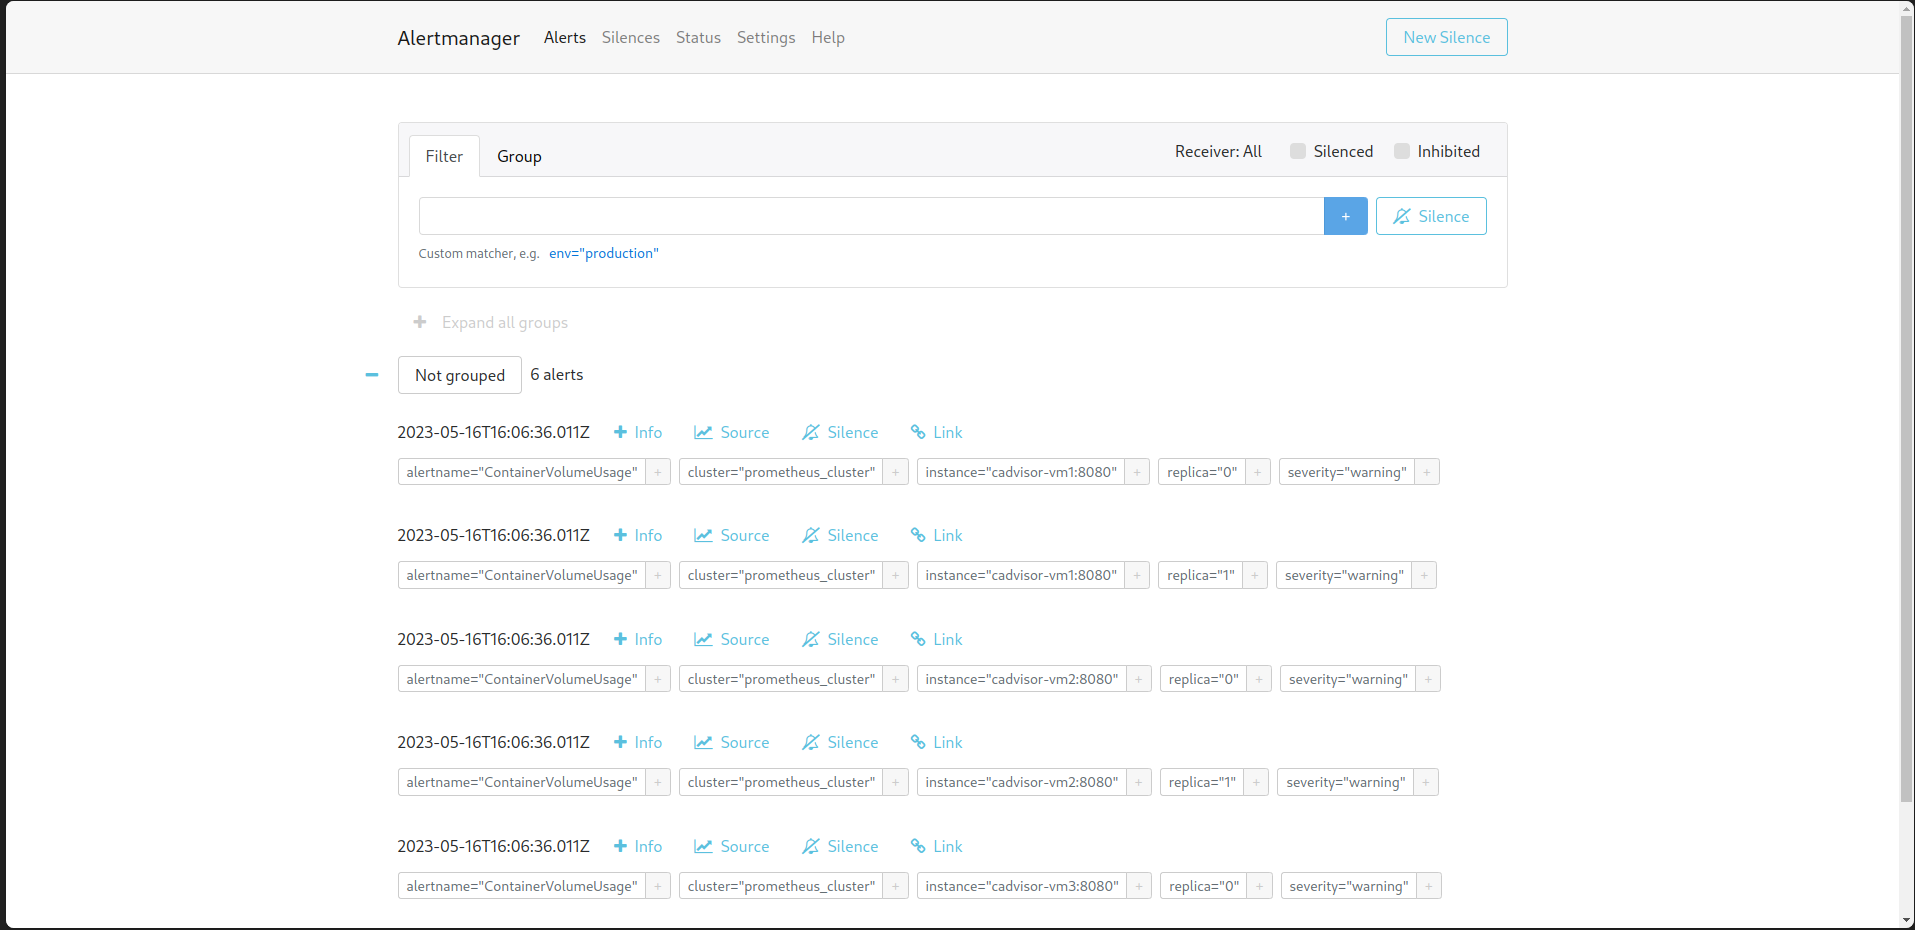
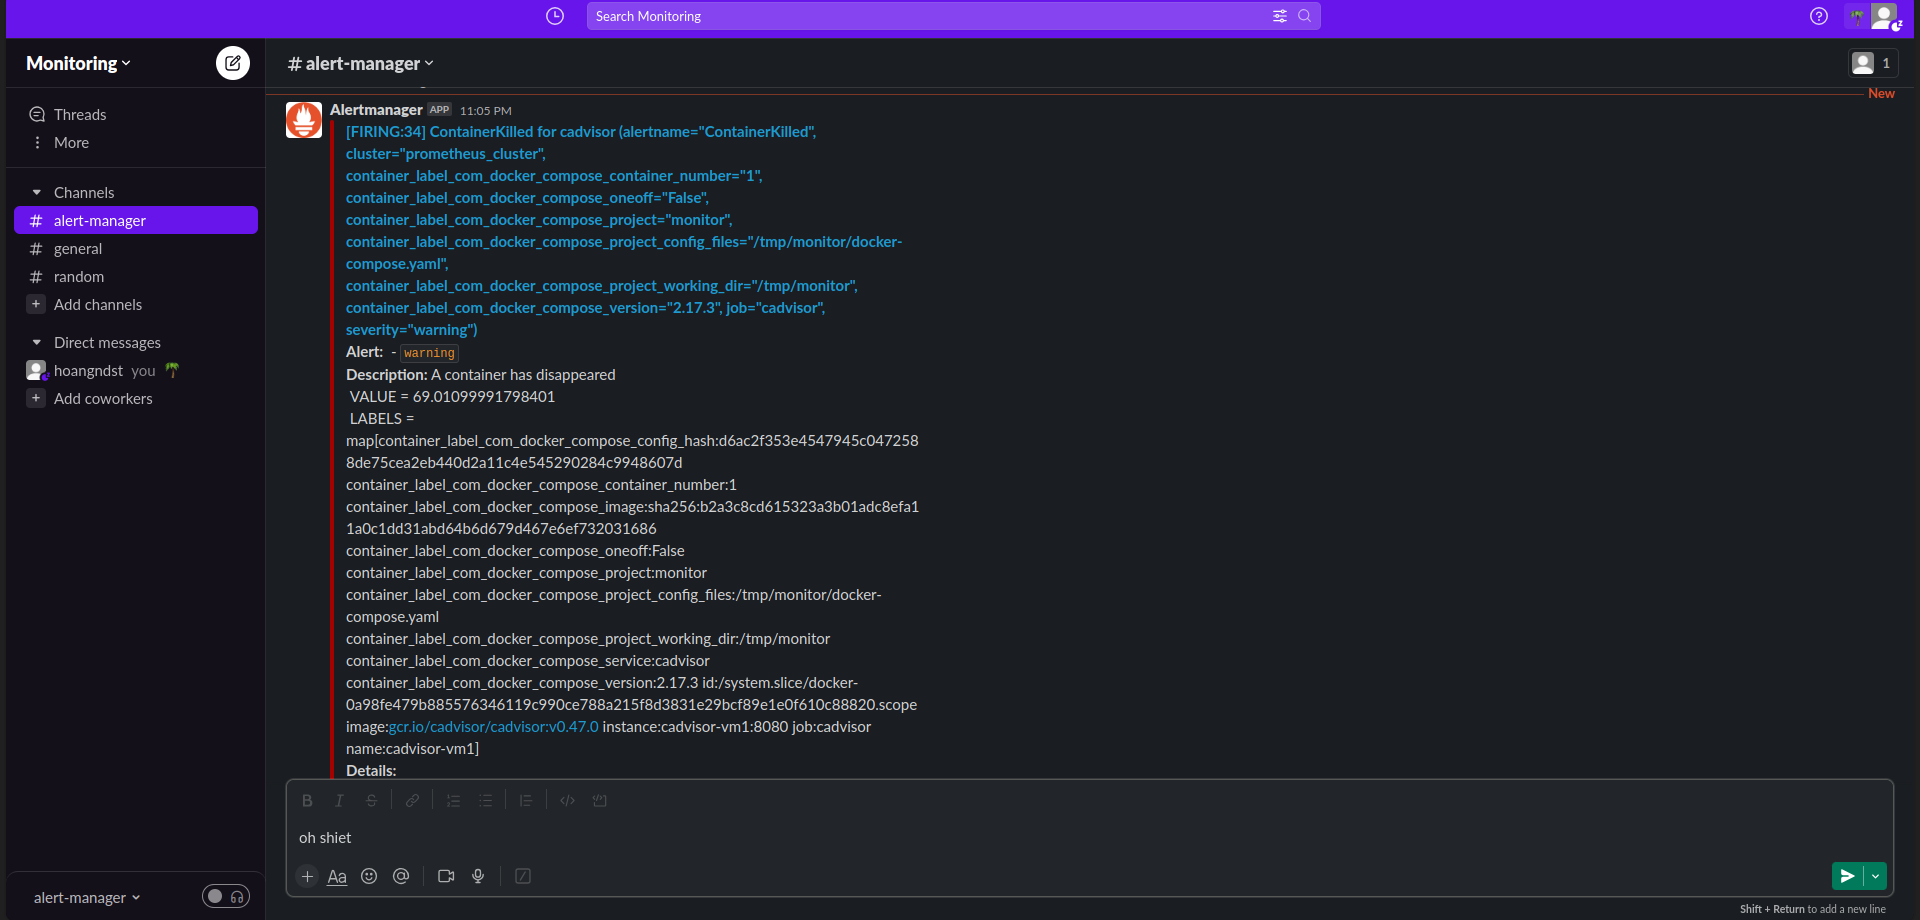
Alertmanager: Handle alerts sent by Prometheus server and send notifications to receivers. -
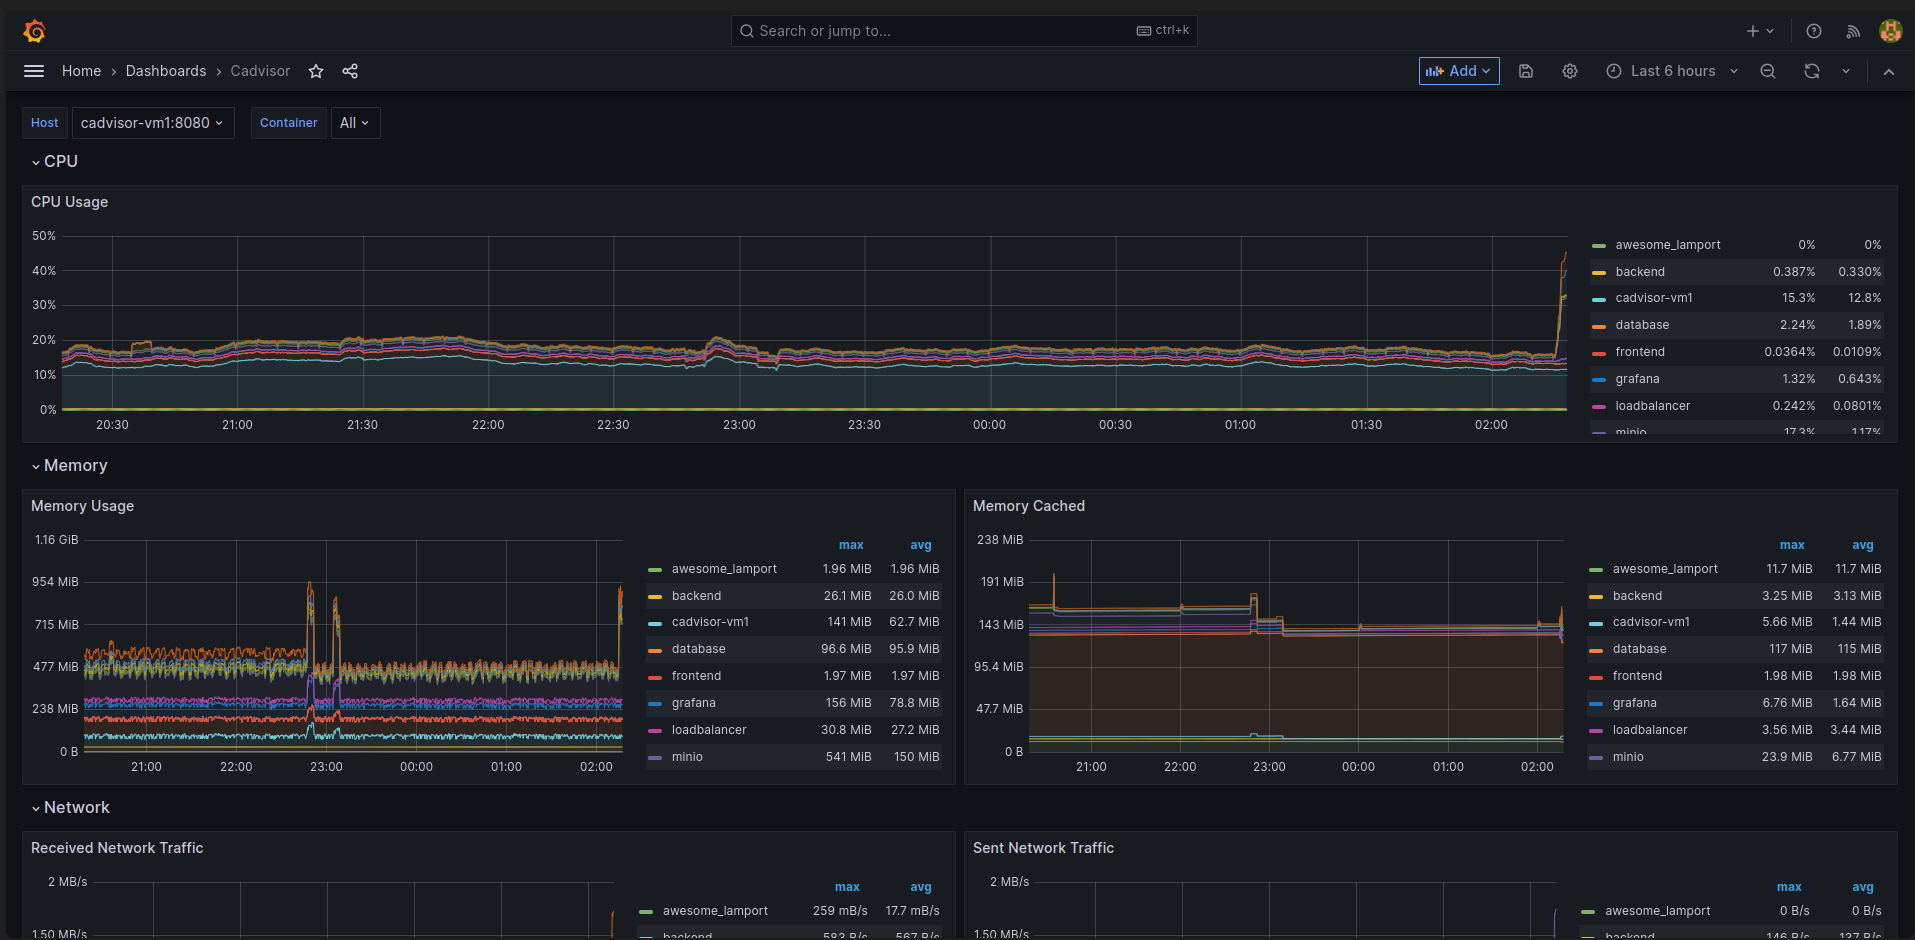
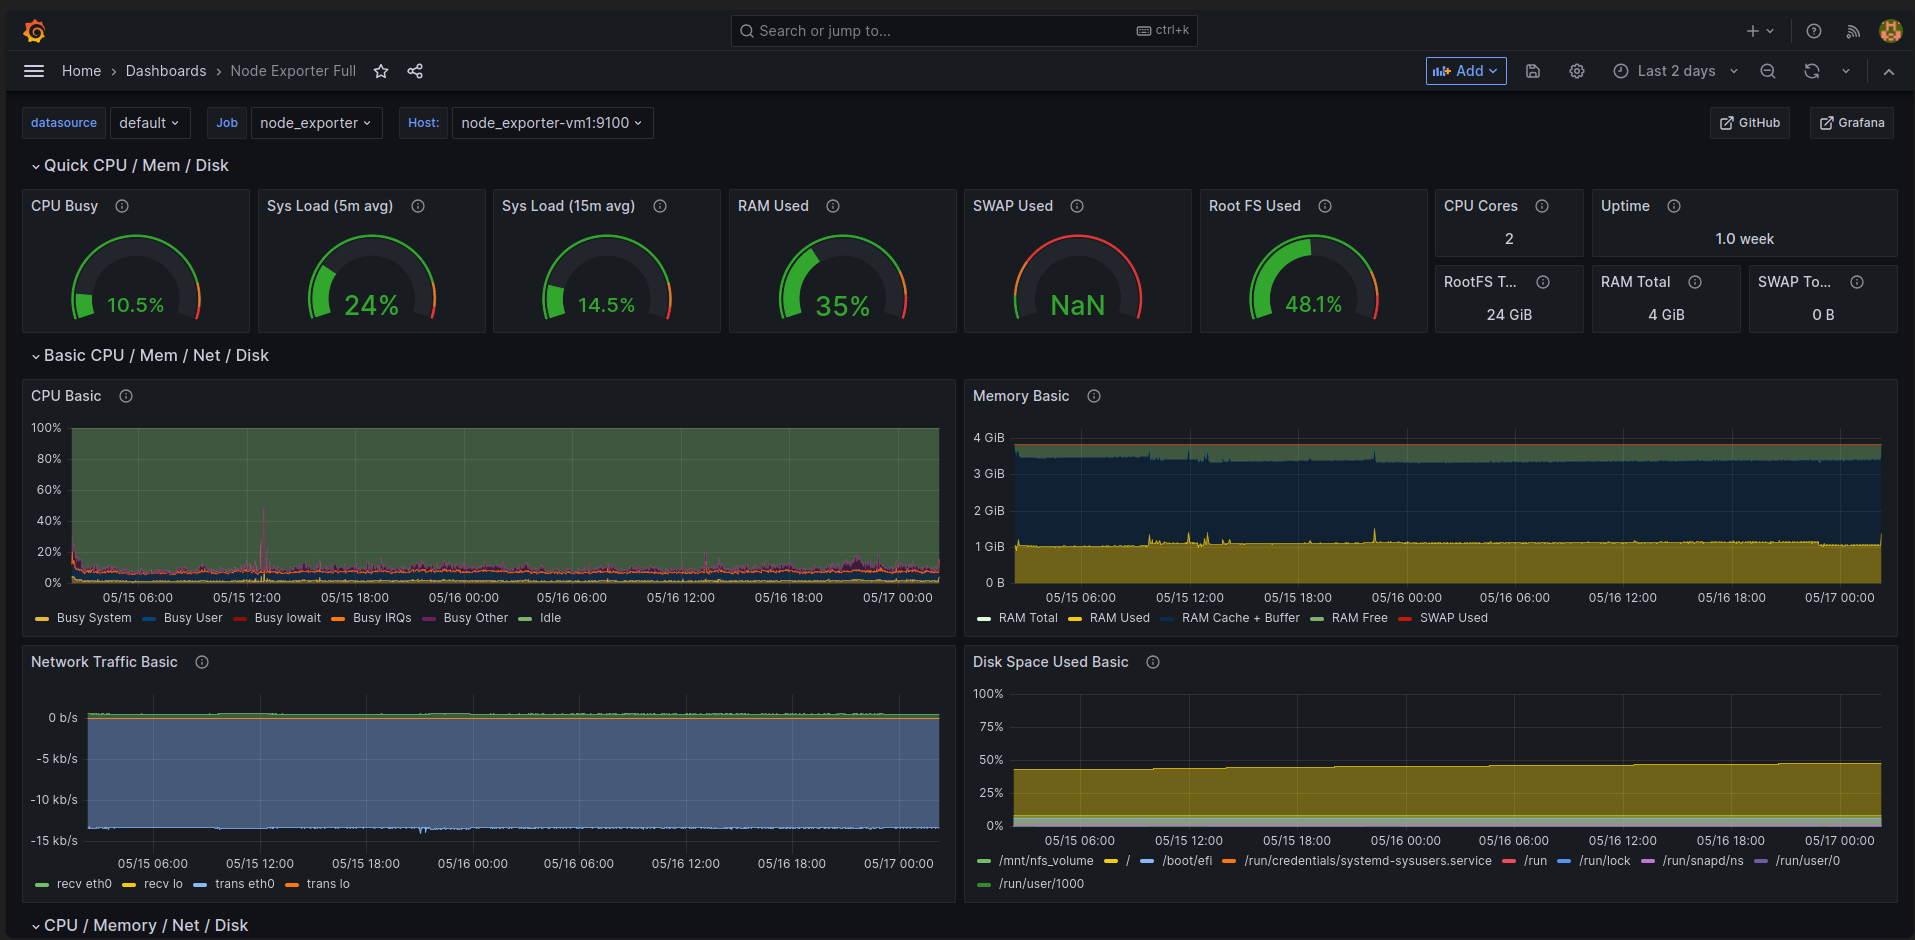
Grafana: Visualize metrics from Prometheus server. -
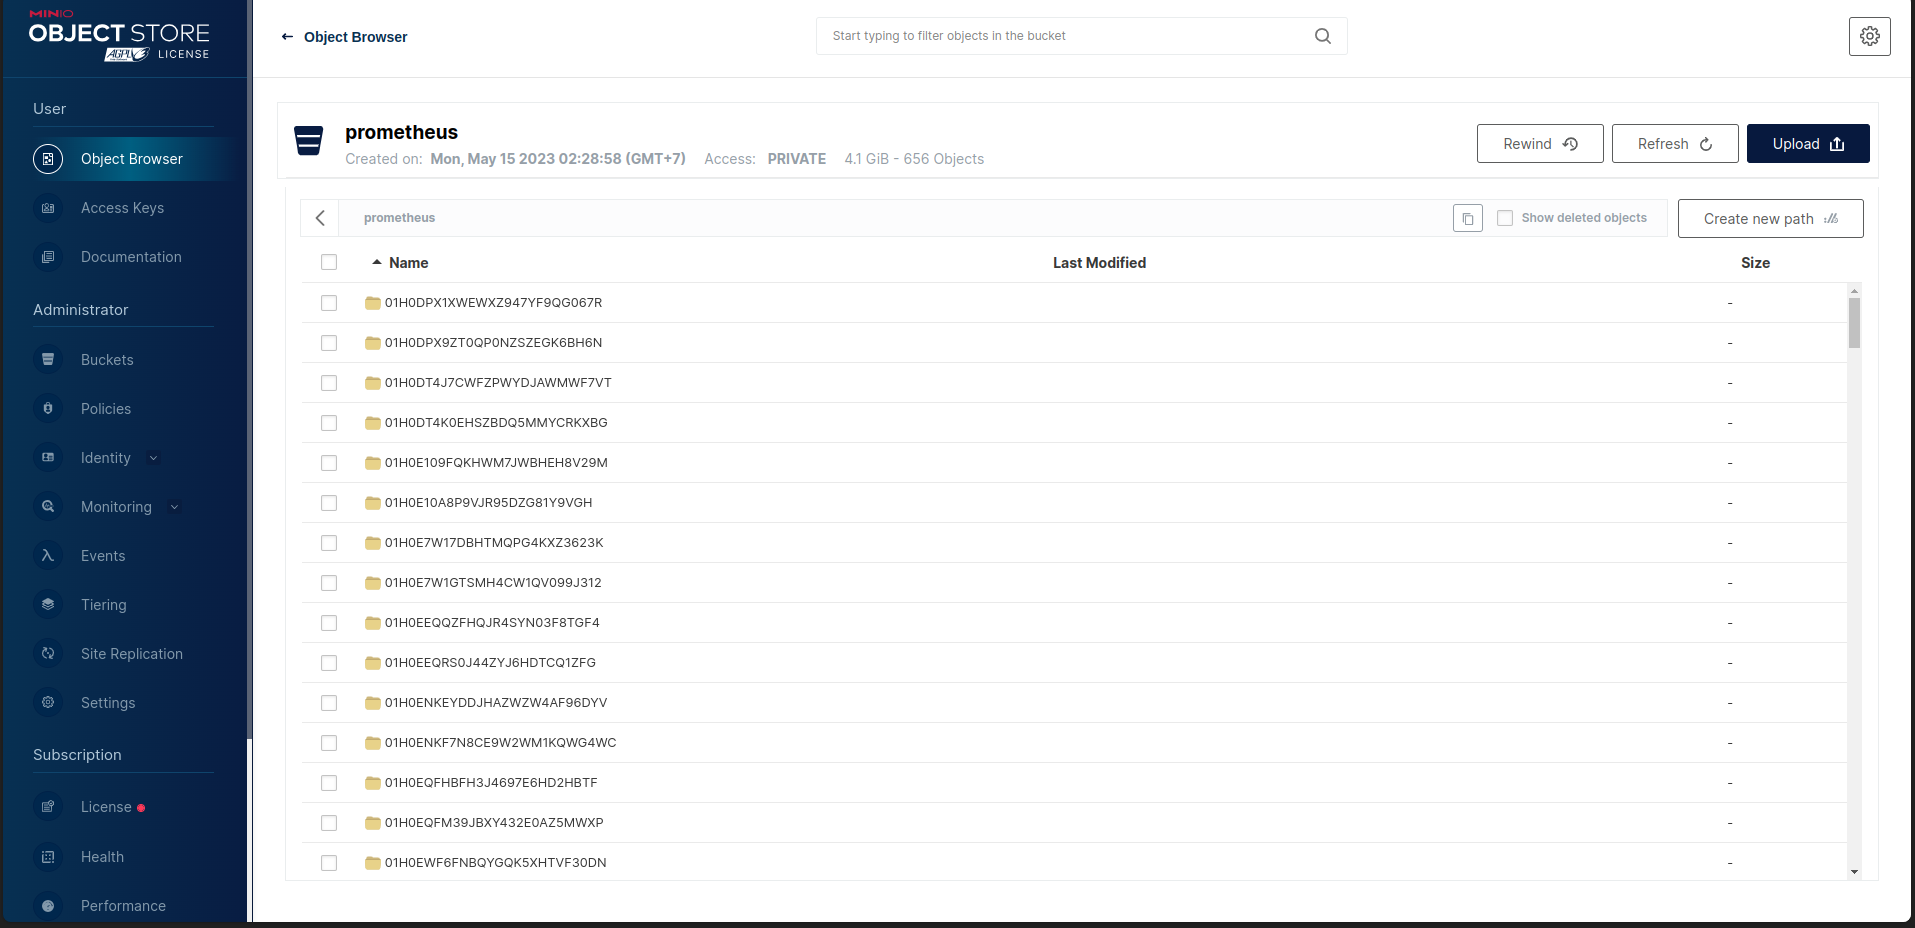
Minio: Object storage for Prometheus server. -
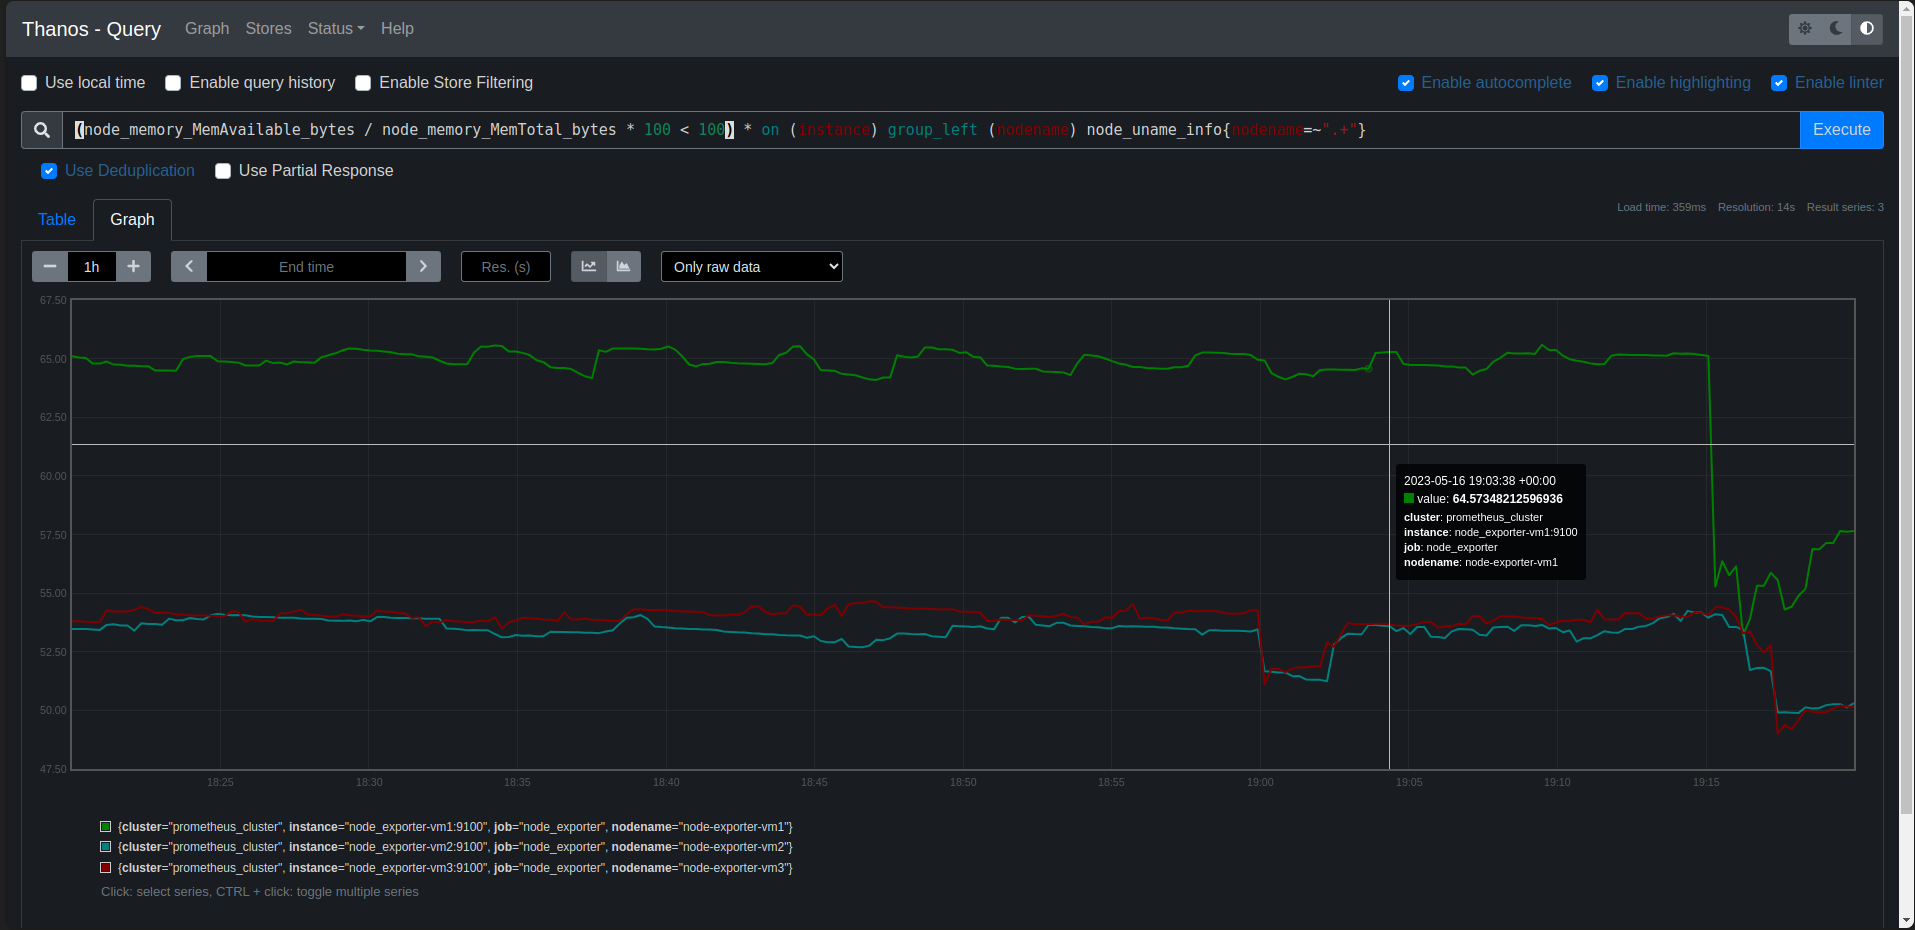
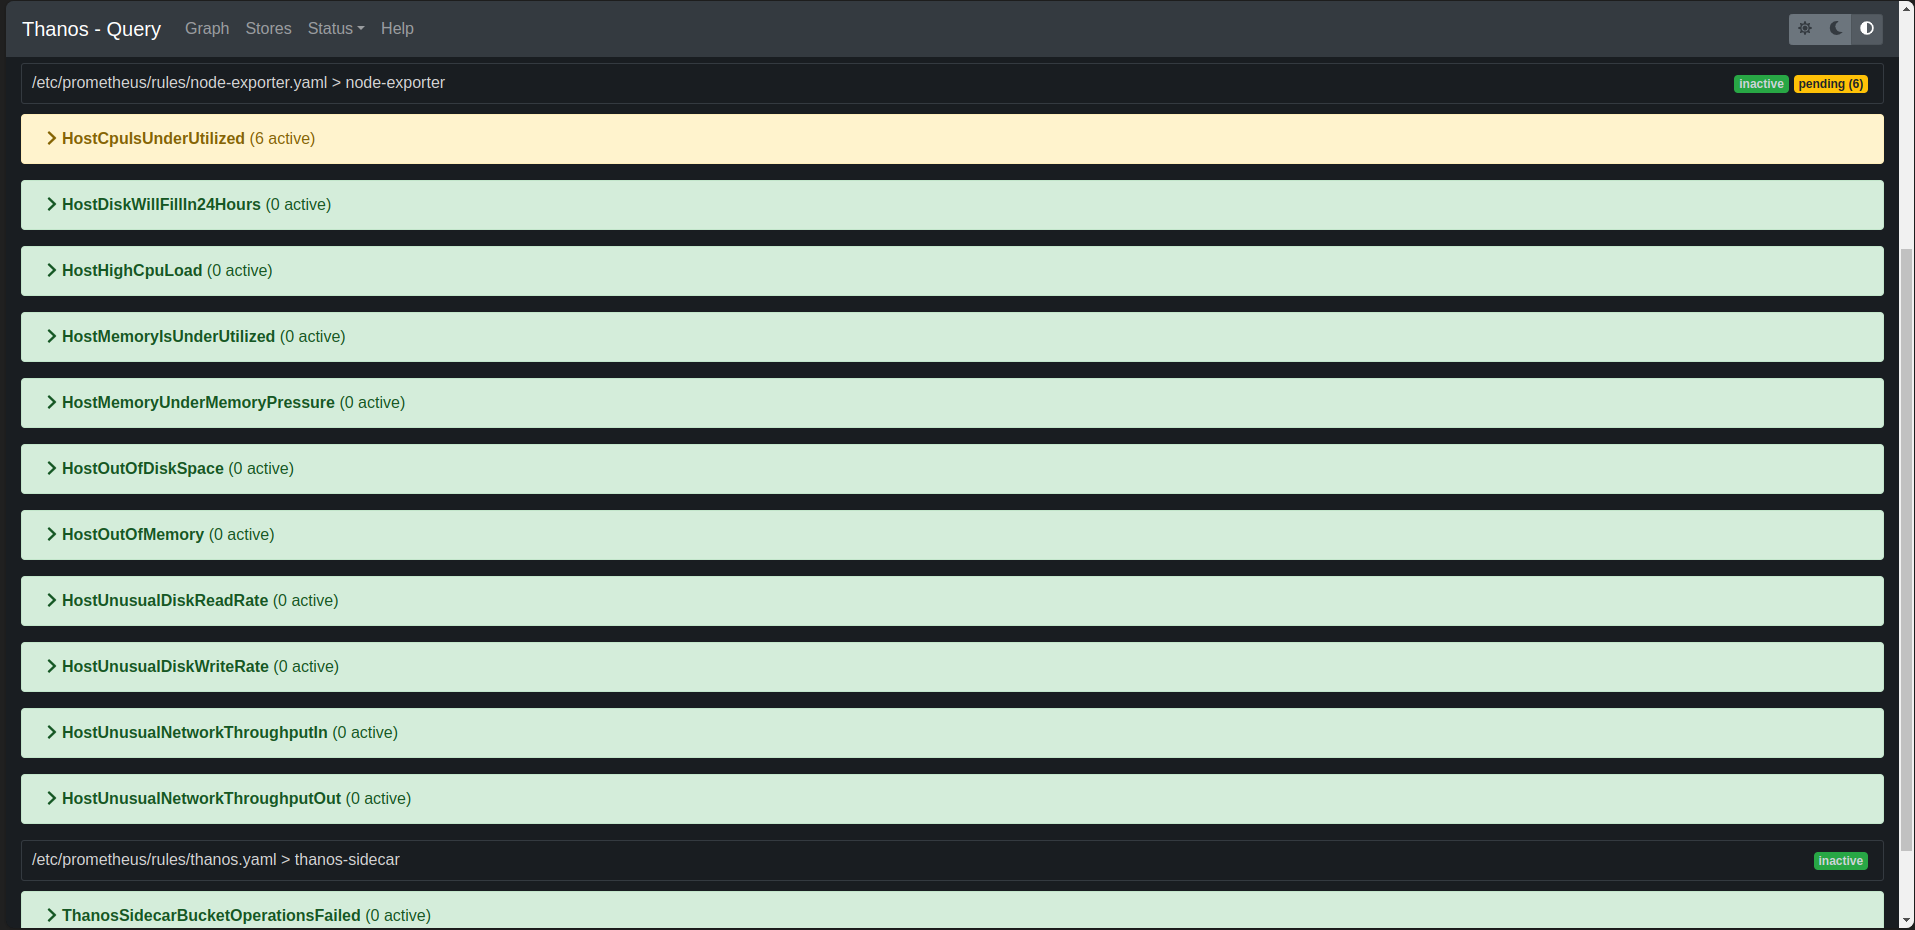
Thanos: Thanos provides a global query view, high availability, data backup with historical, cheap data access as its core features in a single binary. Those features can be deployed independently of each other. This allows you to have a subset of Thanos features ready for immediate benefit or testing, while also making it flexible for gradual roll outs in more complex environments.- Sidecar: connects to Prometheus, reads its data for query and/or uploads it to cloud storage.
- Store Gateway: serves metrics inside of a cloud storage bucket.
- Compactor: compacts, downsamples and applies retention on the data stored in the cloud storage bucket.
- Querier/Query: implements Prometheus’s v1 API to aggregate data from the underlying components.
-
Why I use
Thanosfor High Availability Prometheus + Alertmanager:- Like usual, using Load Balancer to balance traffic to multiple Prometheus servers is not a good idea because Prometheus server stores data in local storage. If we use Load Balancer, we will have to use sticky session to make sure that all requests from a client will be sent to the same Prometheus server. This will make the load balancing not effective.
- Thanos solves this problem. Thanos provides a global query view, high availability, data backup with historical, cheap data access as its core features in a single binary.
- Thanos can query data from multiple Prometheus servers, clusters and store data in cloud storage. This makes it easy to scale Prometheus server and make it highly available. Data is dedublicated and compressed before storing in cloud storage. This makes it cheap to store data in cloud storage.
- You can easily scale Thanos by adding more Sidecar, Store Gateway, Compactor, Querier/Query.
- You can easily backup data by using Compactor to compact, downsample and apply retention on the data stored in the cloud storage bucket.
- You can easily query data from multiple Prometheus servers, clusters by using Querier/Query.
- Default variables:
main.yaml: Default variables for motoringVDT_MONITOR_NET: Monitoring networkPROMETHEUS_VOLUME: Prometheus data volumeMINIO_ACCESS_KEY: Minio access keyMINIO_SECRET_KEY: Minio secret keyMINIO_VOLUME: Minio data volumeGRAFANA_VOLUME: Grafana data volume
- Files:
Alert Manager configuration: Alert Manager configuration fileGrafana configuration: Include Grafana data source, dashboard configuration and dashboard json files.Prometheus Rules: All prometheus rules files
- Templates:
prometheus.yaml.j2: Prometheus configuration filestorage.yaml.j2: Thanos storage configuration filedocker-compose.yaml.j2: Monitoring docker-compose file
- Tasks:
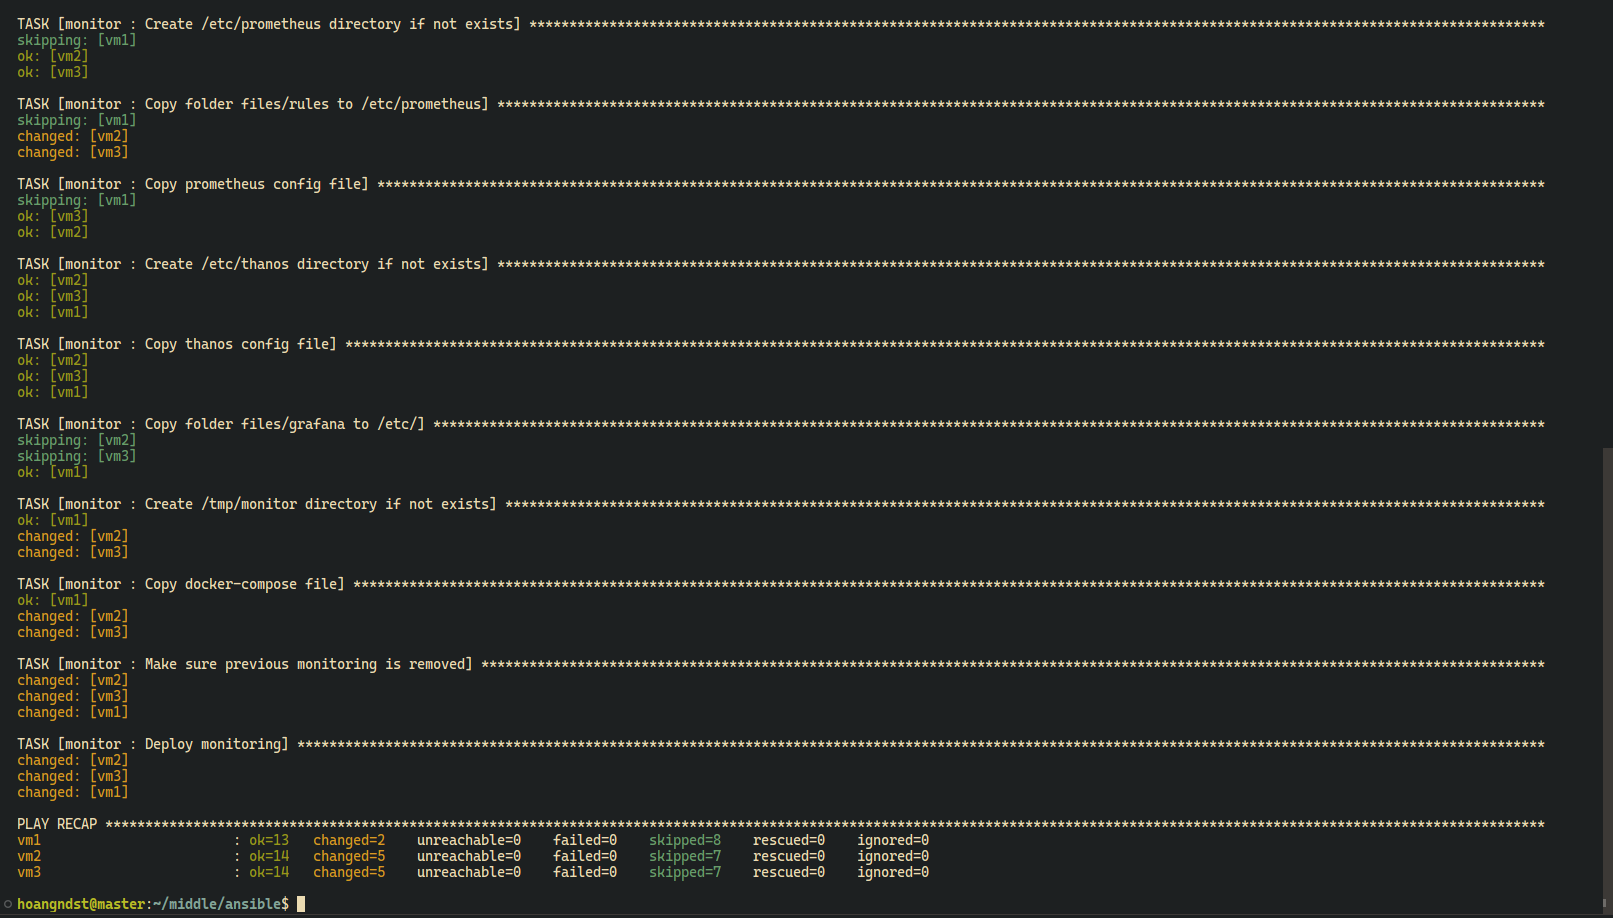
setup.yaml: Setup required docker models for ansible, create docker network if not exists. Copy monitoring configuration files to NFS share folder. This is preparation step for clustering monitoring.deploy.yaml: Deploy monitoringmain.yaml: Include all tasks
- Ansible:
Type your sudo password when prompted
ansible-playbook -i inventories/digitalocean/hosts deploy.yaml -K
Grafana:https://grafana.hoangnd.freeddns.org- Username:
viewer - Password:
Hoang1999
- Username:
Thanos - Prometheus:https://thanos.hoangnd.freeddns.orgAlert Manager - Slack:https://alertmanager.hoangnd.freeddns.orgMinio:https://minio.hoangnd.freeddns.org
DockerfileInstall elasticsearch and fluent-plugin-elasticsearch.FROM fluent/fluentd:v1.12.0-debian-1.0 USER root RUN ["gem", "install", "elasticsearch", "--no-document", "--version", "< 8"] RUN ["gem", "install", "fluent-plugin-elasticsearch", "--no-document", "--version", "5.2.2"] USER fluent
- Build docker image
docker build -t hoangndst/fluentd:latest . - Push docker image to docker hub
docker push hoangndst/fluentd:latest
- Default variables:
main.yaml: Default variables for loggingNETWORK_NAME: Logging network
- Files:
Fluentd configuration: Fluentd configuration files<source> @type forward # Receive events using HTTP or TCP protocol port 24224 # The port to listen to bind 0.0.0.0 # The IP address to listen to </source> <match docker.**> # Match events from Docker containers @type copy <store> @type elasticsearch # Send events to Elasticsearch host 171.236.38.100 # The IP address of the Elasticsearch server port 9200 # The port of the Elasticsearch server index_name hoangnd # The name of the index to be created logstash_format true # Enable Logstash format logstash_prefix hoangnd # The prefix of the index to be created logstash_dateformat %Y%m%d # The date format of the index to be created include_tag_key true # Enable including the tag in the record type_name access_log flush_interval 1s # The interval to flush the buffer </store> <store> @type stdout </store> </match>
- Tasks:
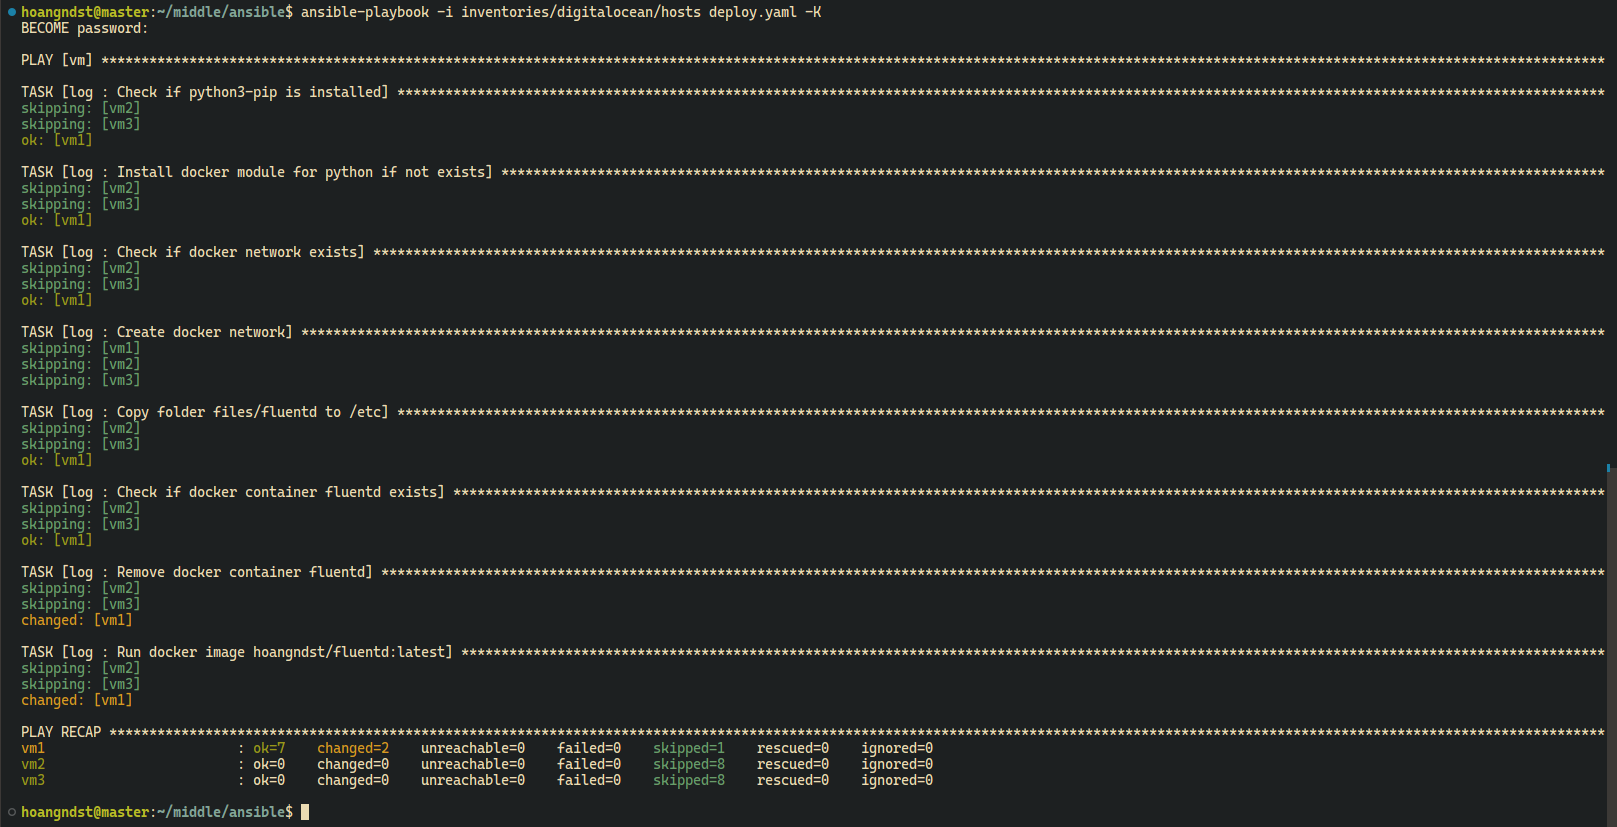
setup.yaml: Setup required docker models for ansible, create docker network if not exists.deploy.yaml: Deploy loggingmain.yaml: Include all tasks
- Ansible:
Type your sudo password when prompted
ansible-playbook -i inventories/digitalocean/hosts deploy.yaml -K
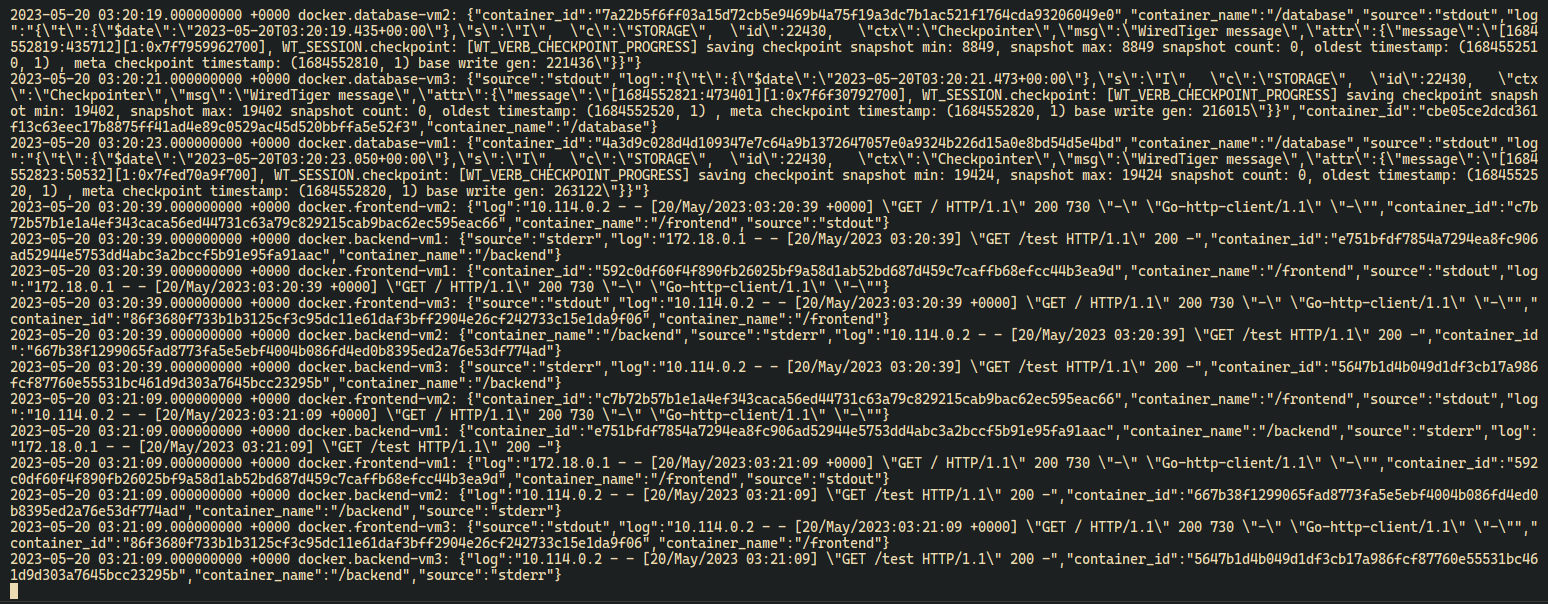
- Fluentd Container Logs
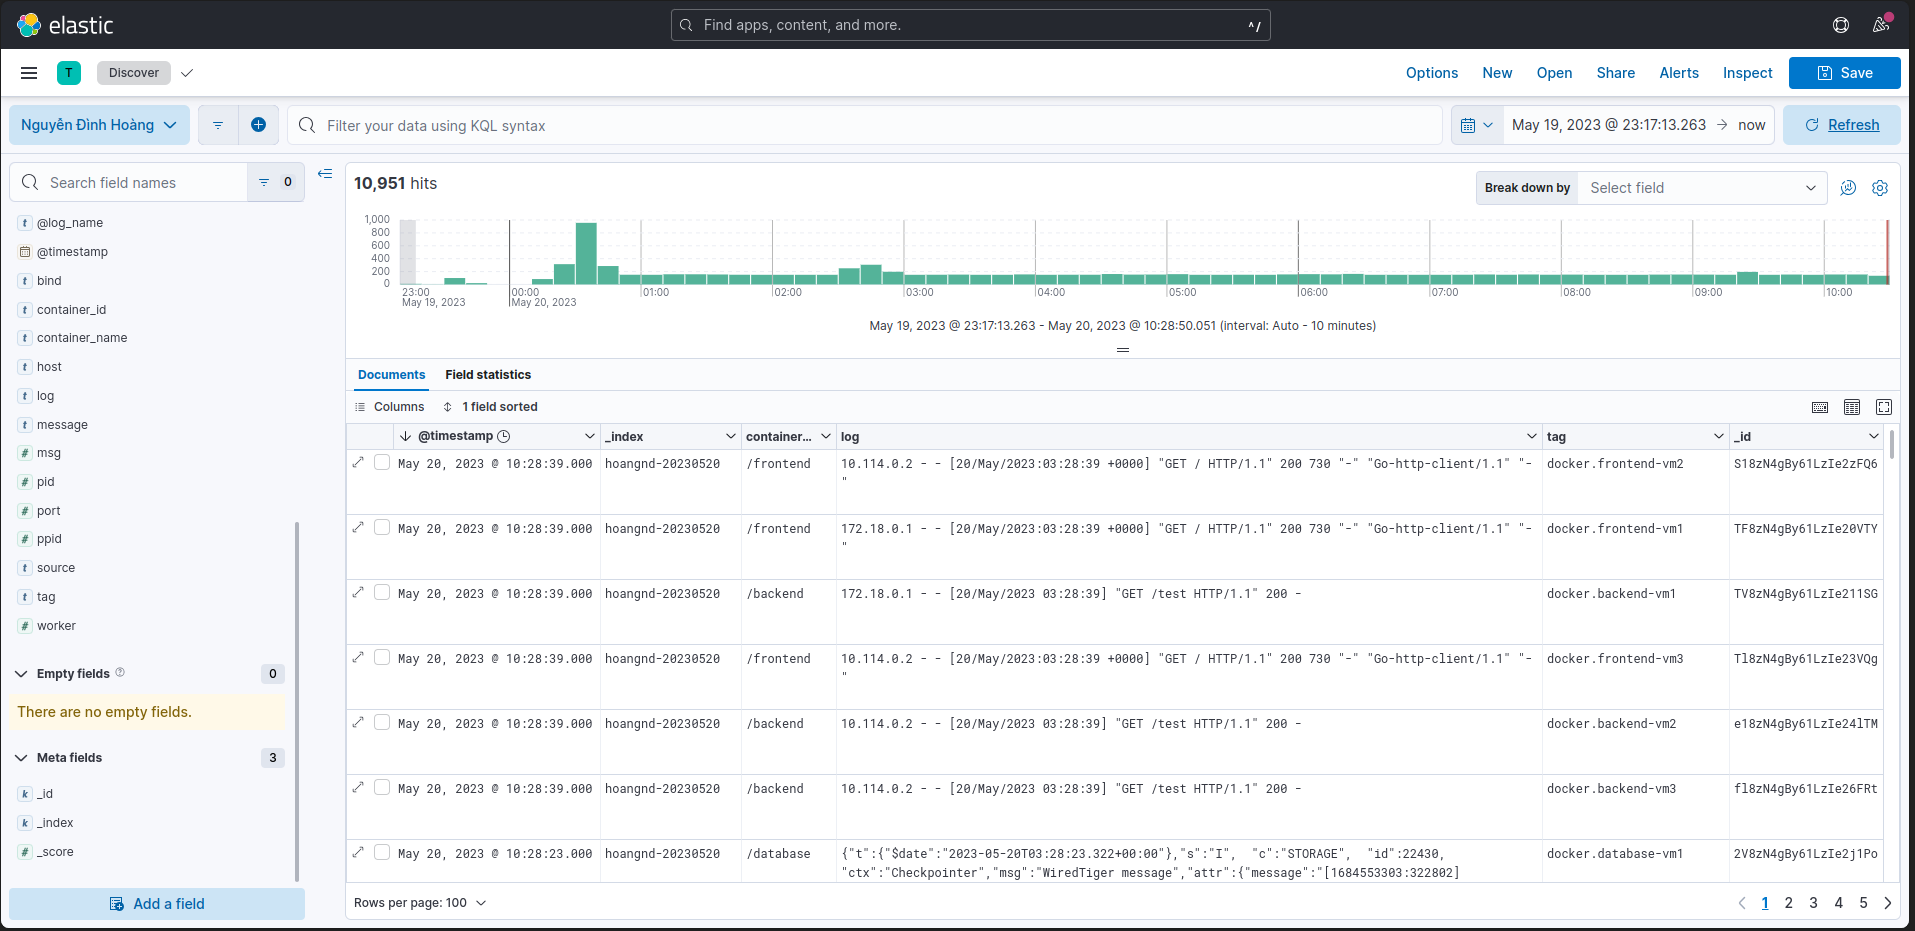
- Kibana
Frontend:https://vdt-frontend.hoangnd.freeddns.orgBackend:https://vdt-backend.hoangnd.freeddns.orgTraefik:https://traefik.hoangnd.freeddns.orgGrafana:https://grafana.hoangnd.freeddns.org- username:
viewer - password:
Hoang1999
- username:
Thanos - Prometheus:https://thanos.hoangnd.freeddns.orgAlert Manager:https://alertmanager.hoangnd.freeddns.orgMinio:https://minio.hoangnd.freeddns.org


