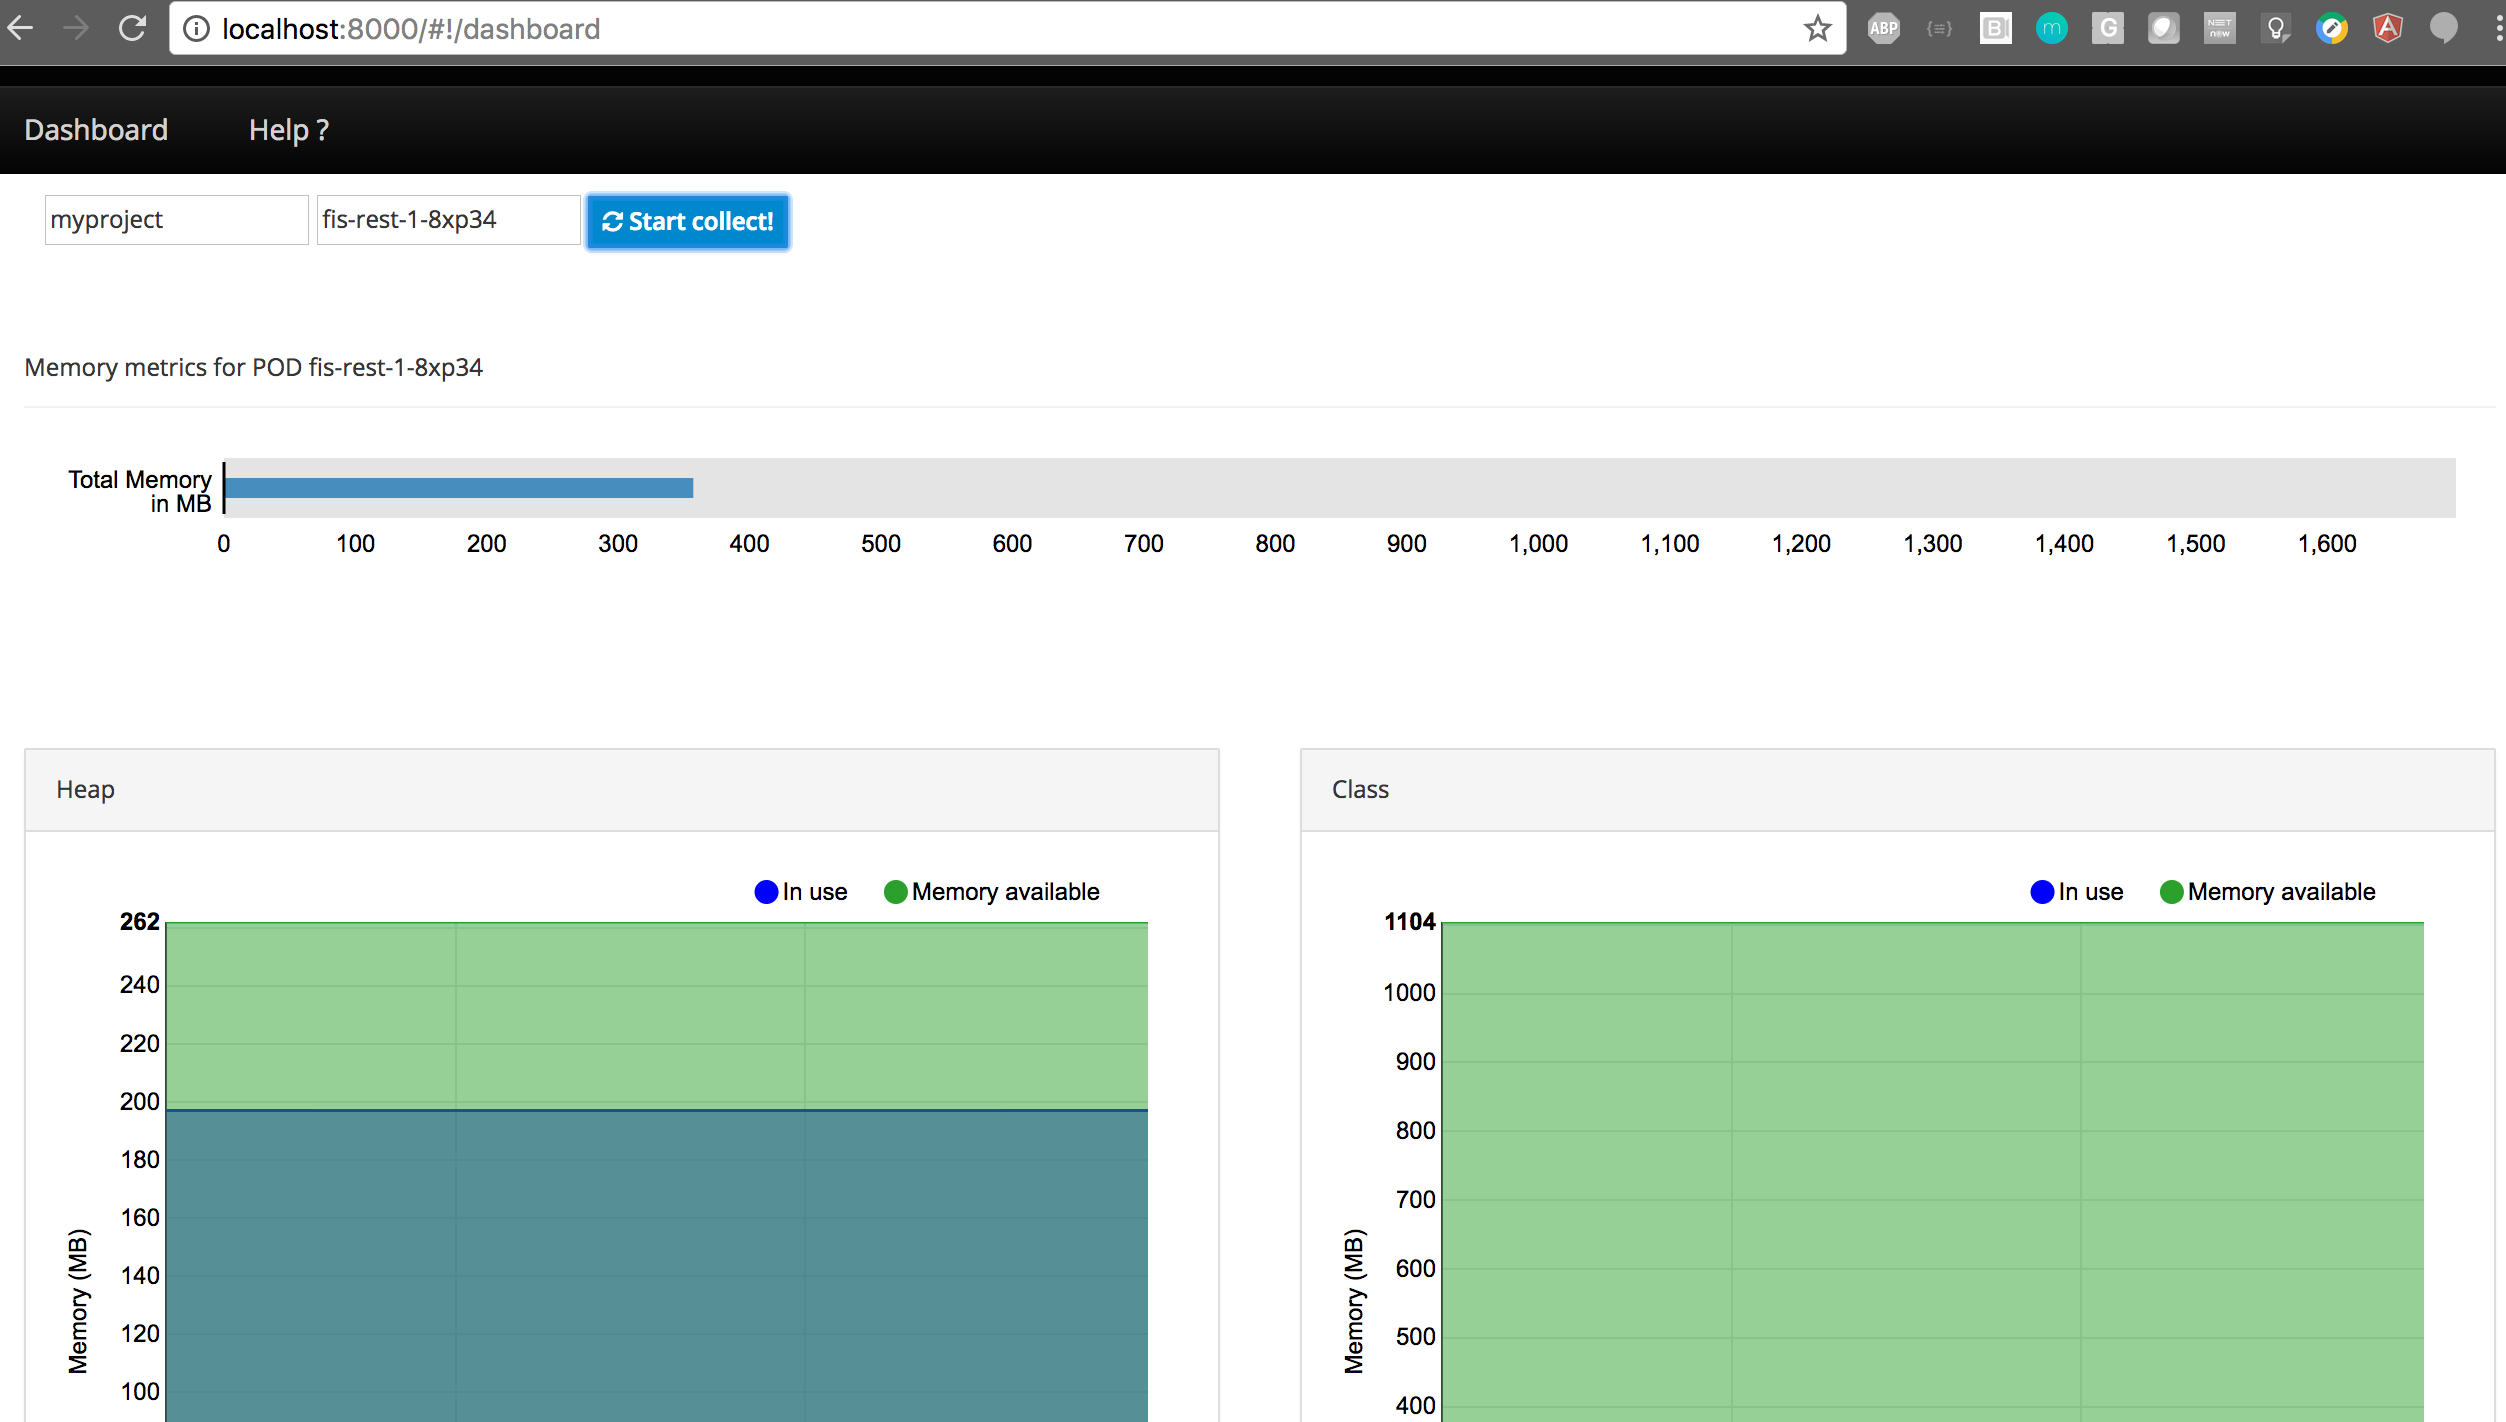
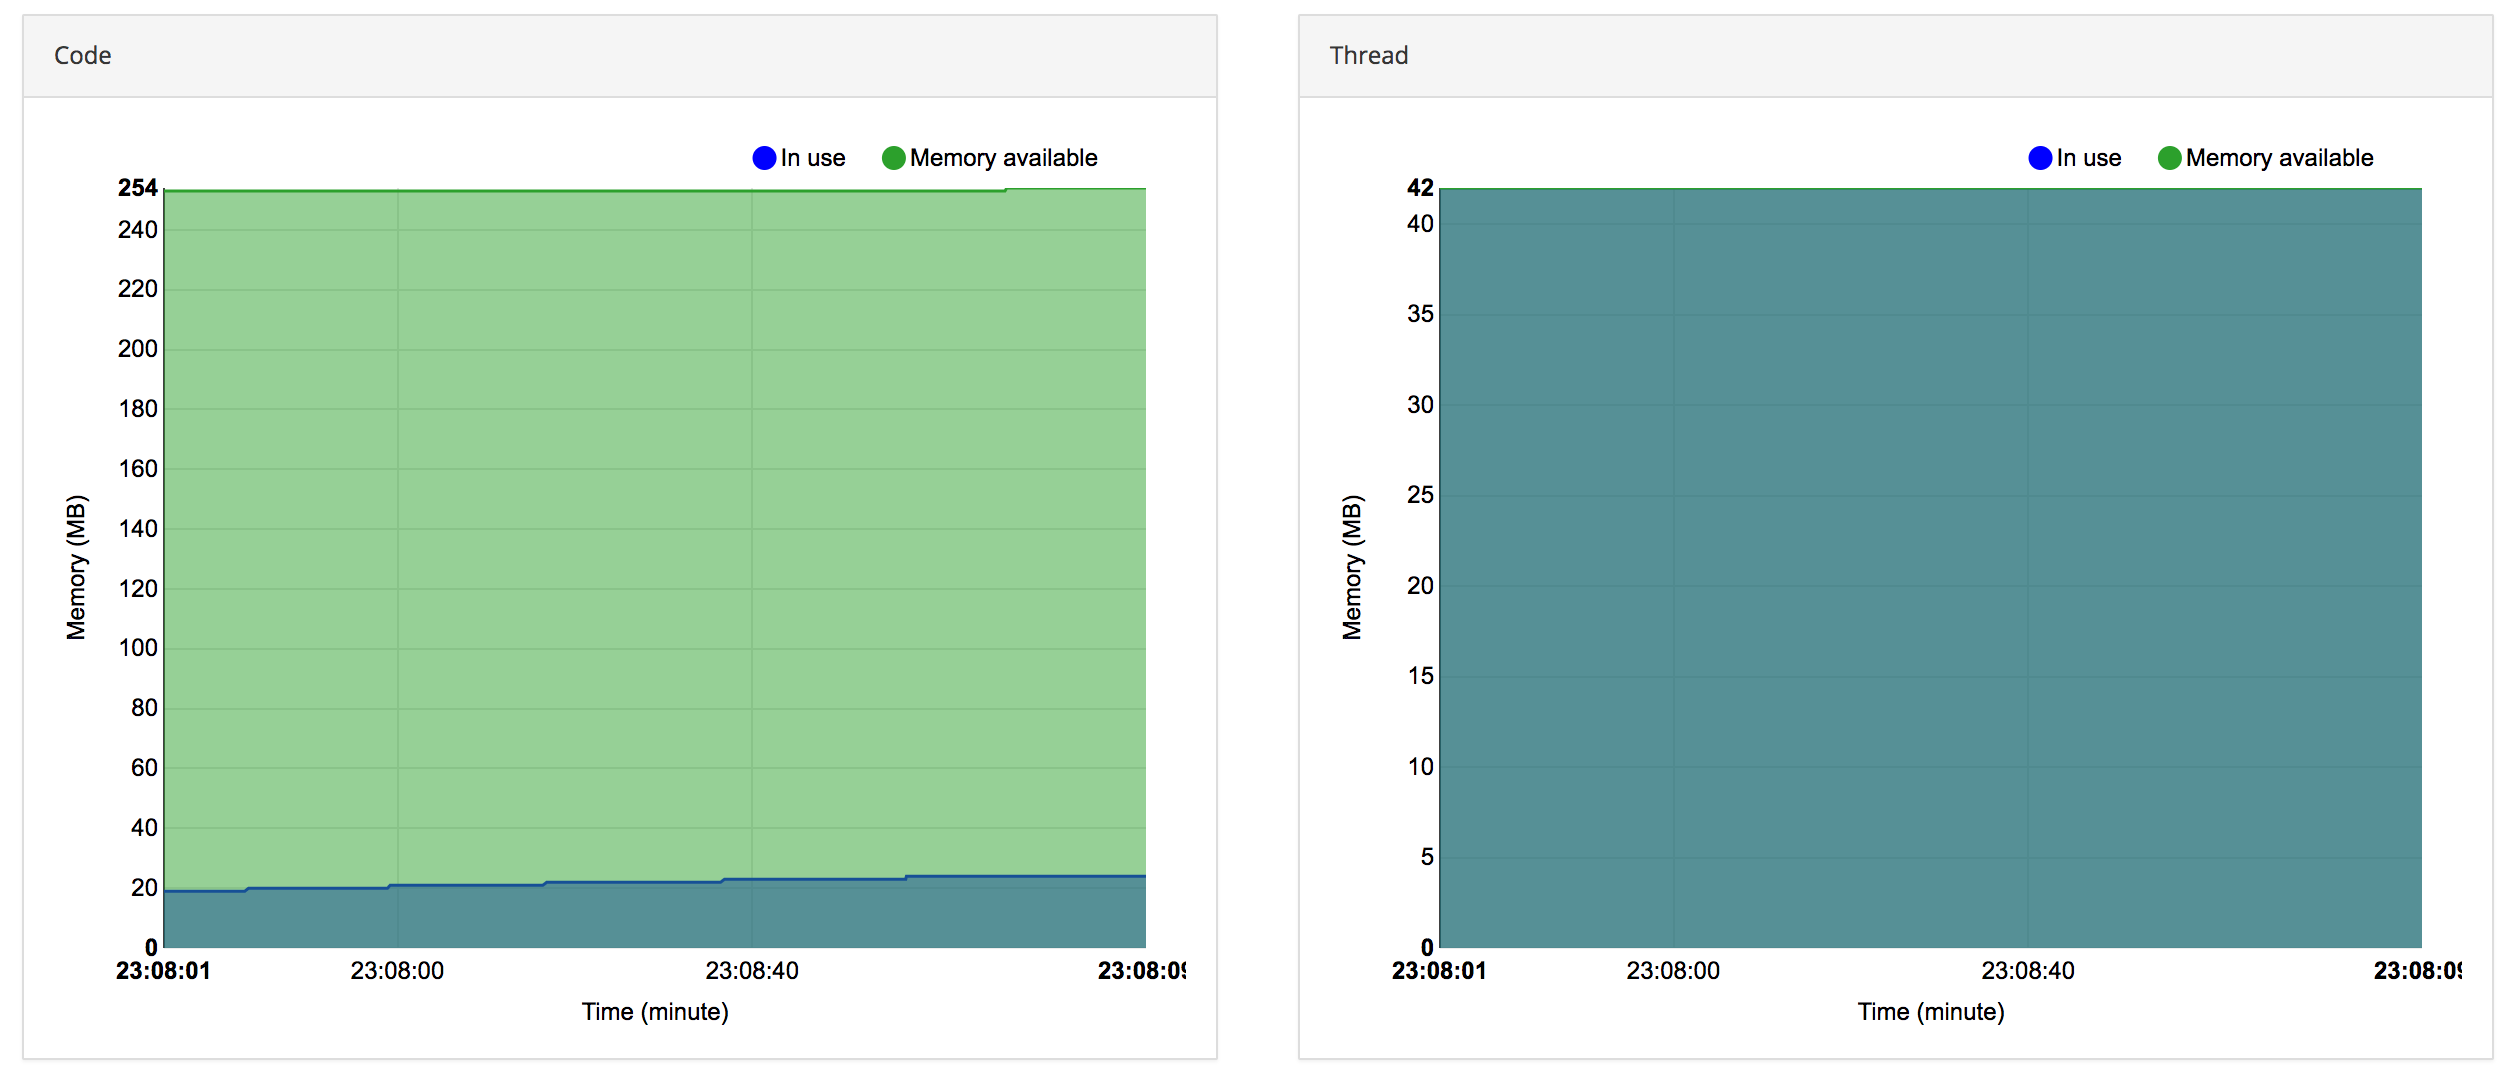
This tool is responsible for crawling Java memory tracking reports in containized environments using Kubernetes.
It summarizes those statistics and display it in a dashboard.
It's helpful to do tuning, find memory leaks, etc.
This version is tigh acoppled with Kubernetes/Openshift/Origin, so you need oc client
Before start the analisys you need to be already logged in in the kubernetes system.
oc login -u <user> https://<your-kubernetes-master-url>.com:8443
Your java application under analisys must have the parameter -XX:NativeMemoryTracking=summary
    cd jmt-api
    npm install
    npm start run
It starts a server in http://localhost:3000
    cd jmt-ui
    npm install
    npm start run
With both running you now can access the dashboard: http://localhost:8000

