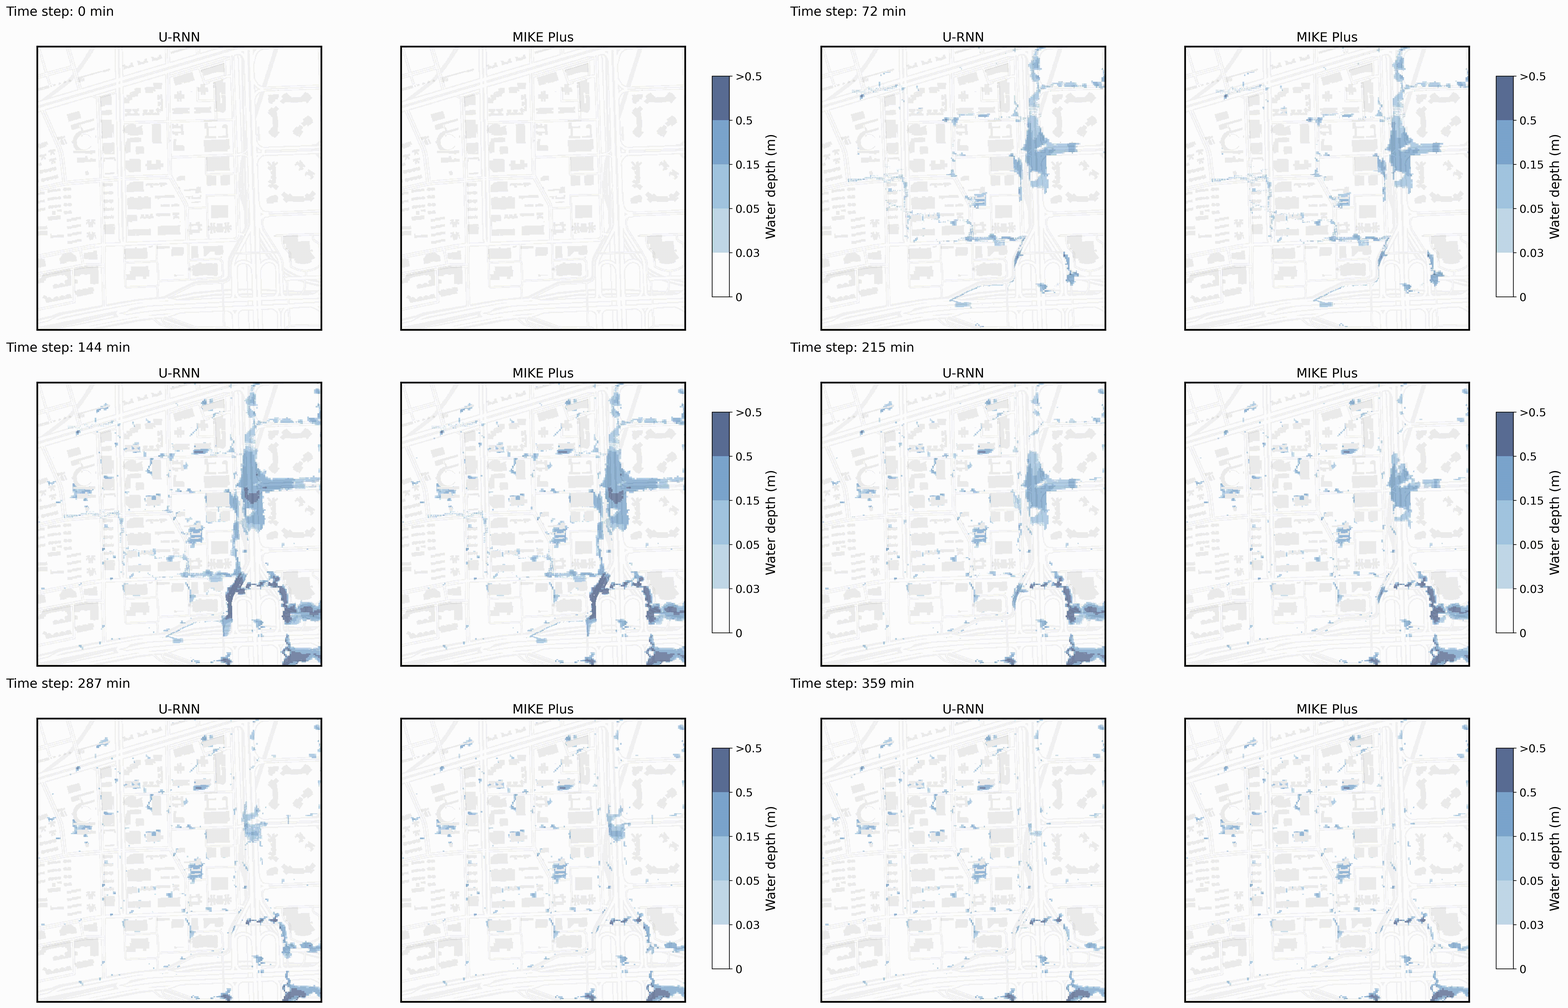
- Visualization of a measured rainfall forecast
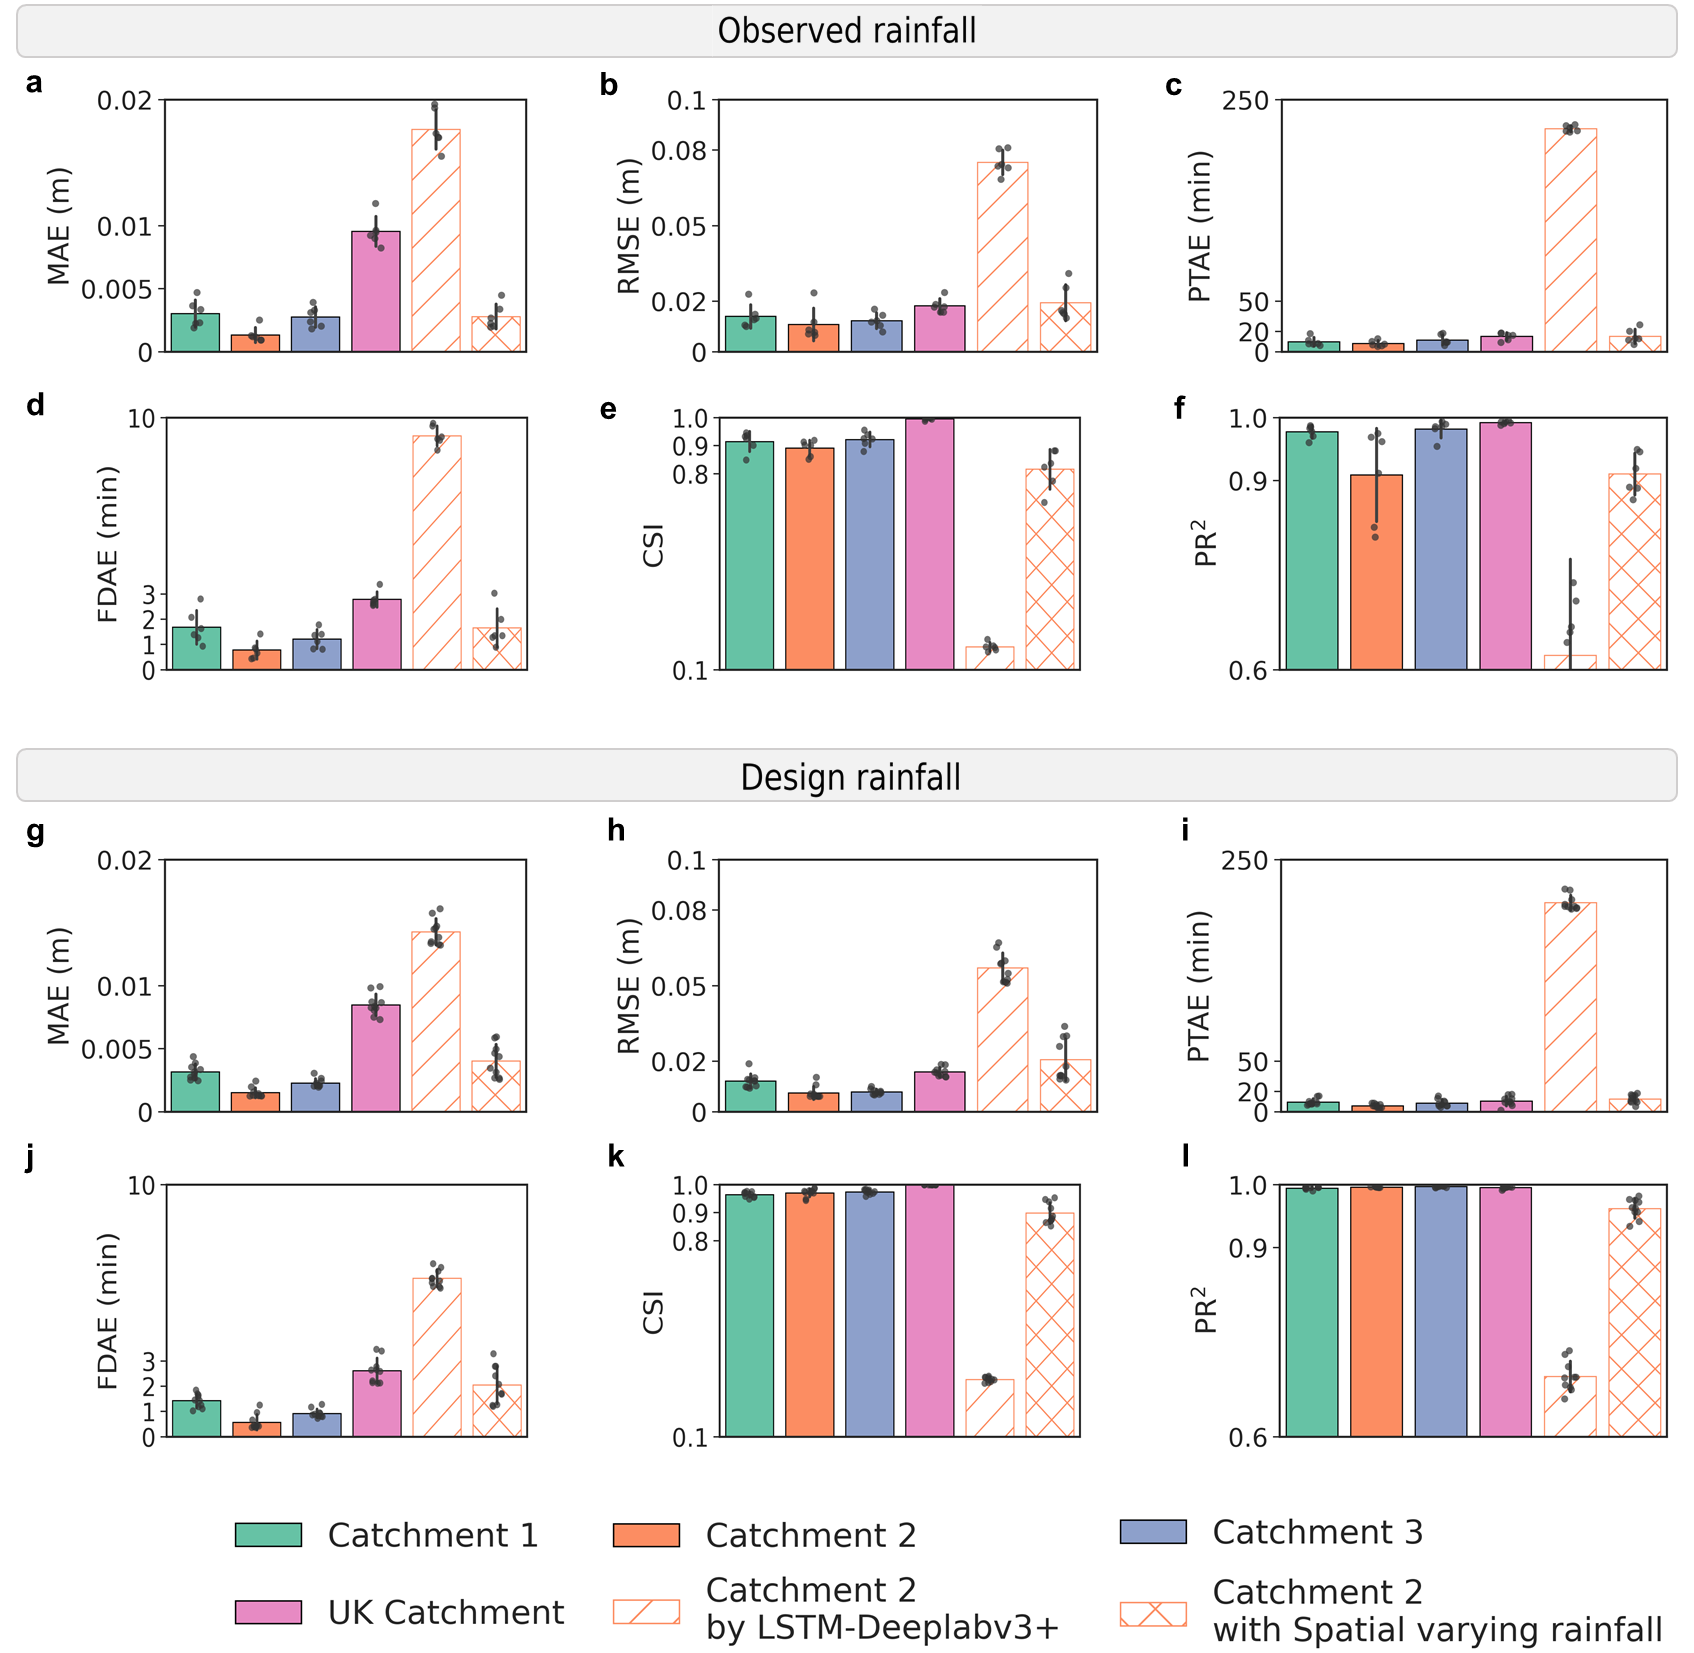
- Quantitative evaluation on the test set
- Download the code repository.
git clone https://github.com/holmescao/U-RNN
- Install Python dependencies. (We use Python 3.8 and PyTorch 2.0.0 on a compatible NVIDIA GeForce RTX 4090).
conda create -n urnn python=3.8
conda activate urnn
pip install torch==2.0.0 torchvision==0.15.1 torchaudio==2.0.1 --index-url https://download.pytorch.org/whl/cu118
cd U-RNN # Into the code root directory
pip install -r requirements.txt -i https://pypi.tuna.tsinghua.edu.cn/simple-
Other required dependencies
-
CUDA 11.8
-
cuDNN 8.9.0
-
Note: other versions will also work, as long as the PyTorch, GPU, CUDA and cuDNN versions are compatible.
Download urban flood dataset (note: it was uploaded to Figshare.com, and DOI will be available soon), unzip and put it into the path (<U-RNN_HOME>/data).
The dataset structure as follow:
data
└── urbanflood24
    ├── test
    │   └── flood
    │       └── location16
    │           ├── G1135_intensity_103
    │           │   ├── flood.npy
    │           │   └── rainfall.npy
	...
        └── geodata
            └── location16
                ├── absolute_DSM.npy
                ├── impervious.npy
                └── manhole.npy
    ...
    └── train
        ├── flood
        │   └── location16
        │       ├── G1135_intensity_117
        │       │   ├── flood.npy
        │       │   └── rainfall.npy
	...
        └── geodata
            └── location16
                ├── absolute_DSM.npy
                ├── impervious.npy
                └── manhole.npy
...We provide the trained U-RNN model weights. Please download and put it into the path (<U-RNN_HOME>/exp/20240202_162801_962166/save_model/checkpoint_939_0.000205376.pth.tar).
Run the follow command in your terminal:
CUDA_VISIBLE_DEVICES=0 python -m torch.distributed.launch --nproc_per_node=1 main.py --device 0 --batch_size 1 --seq_num 28 --use_checkpointThe root directory for the experimental result is in the path (<U-RNN_HOME>/exp). This script will generate a timestamp as the experiment name and create a folder for saving related files, for example, <U-RNN_HOME>/exp/20240202_162801_962166.
-
First, open
test.py, locate the next line ofif __name__ == "__main__":, and set thetimestampvariable value to the experiment name of your trained model, e.g.,timestamp=20240202_162801_962166. -
Then, run the follow command in your terminal:
python test.pyThe results will be saved in the path (<U-RNN_HOME>/exp/<your_expr_name>/figs/). For each rainfall event you will obtain a visualization of the inference results, as shown below:
- Convert the model from PyTorch to TensorRT. (We use TensorRT 10.0.0.6).
- First, open
urnn_to_tensorrt.py, locate the next line ofif __name__ == "__main__":, and set thetimestampvariable value to the experiment name of your trained model, e.g.,timestamp=20240202_162801_962166. - Then, run the follow command in your terminal:
- First, open
python urnn_to_tensorrt.pyYou will get a TensorRT model URNN.trt in the path (<U-RNN_HOME>/exp/<your_expr_name>/tensorrt/) .
- Inference using TensorRT
python test.py --trtThe results will be saved in the path (<U-RNN_HOME>/exp/<your_expr_name>/figs/) .
If you find this project useful, please consider to cite our paper. Thank you!
@article{cao4935234u,
  title={U-Rnn High-Resolution Spatiotemporal Nowcasting of Urban Flooding},
  author={Cao, Xiaoyan and Wang, Baoying and Yao, Yao and Zhang, Lin and Xing, Yanwen and Mao, Junqi and Zhang, Runqiao and Fu, Guangtao and Borthwick, Alistair GL and Qin, Huapeng},
  journal={Available at SSRN 4935234}
}


