- Clone the repository
- Make sure you installed Python 3 and python3-pip:
$ sudo apt-get install python3
$ sudo apt-get install python3-pip
- Install the Prometheus Python client:
$ sudo pip3 install -U setuptools
$ sudo pip3 install -U pip
$ sudo pip3 install prometheus_client requests
It's easier to start NeuVector exporter as a container. The following section describe how to start the exporter in the Docker environment. A kubernetes sample yaml file, nv_exporter.yml, is also included.
Modify both docker-compose.yml and nv_exporter.yml. Specify NeuVector controller's RESTful API endpoint CTRL_API_SERVICE, login username CTRL_USERNAME, password CTRL_PASSWORD, and the port that the export listens on through environment variables EXPORTER_PORT. Optionally, you can also specify EXPORTER_METRICS to a comma-separated list of metric groups to collect and export. It's highly recommanded to create a read-only user account for the exporter.
Metric groups:
summary- overall NeuVector statusconversation- total bytes for every conversation between workloadsenforcer- enforcer CPU and memory usagehost- host memory usageadmission- number of allowed and denied Kubernetes admission requestsimage_vulnerability- number of high and medium vulnerabilities for every scanned registry imagecontainer_vulnerability- number of high and medium vulnerabilities for every service, reporting a single pod's status per service (excluding service mesh sidecars)log- data for the latest threat, incident, and violation logs (latest 5 logs each)
| Variable | Description | Default |
|---|---|---|
CTRL_API_SERVICE |
NeuVector controller REST API service endpoint | nil |
CTRL_USERNAME |
Username to login to controller REST API service | admin |
CTRL_PASSWORD |
Password to login to controller REST API service | admin |
EXPORTER_PORT |
The port that the export is listening on | nil |
ENFORCER_STATS |
For the performance reason, by default the exporter does NOT pull CPU/memory usage from enforcers. Enable this if you want to see the metrix in the dashboard | 0 |
Start NeuVector exporter container.
$ docker-compose up -d
- Open browser, go to: [exporter_host:exporter_port] (example: localbost:8068)
- If you can load the metric page, the exporter is working fine.
Add and modify the exporter target in your prometheus.yml file under scrape_configs:
scrape_configs:
  - job_name: prometheus
    scrape_interval: 10s
    static_configs:
      - targets: ["localhost:9090"]
  - job_name: nv-exporter
    scrape_interval: 30s
    static_configs:
      - targets: ["neuvector-svc-prometheus-exporter.neuvector:8068"]
Start Prometheus container.
$ docker run -itd -p 9090:9090 -v $(pwd)/prometheus.yml:/etc/prometheus/prometheus.yml --name prometheus prom/prometheus
- After deployed Prometheus, open browser and go to: [prometheus_host:9090] (example: localhost:9090)
- On the top bar go to
Status -> Targetsto check exporter status. If the name is blue andStateis UP, the exporter is running and Prometheus is successfully connected to the exporter. - On the top bar go to
Graphand in theExpressionbox typenvto view all the metrics the exporter has.
Start NeuVector exporter pod and service.
$ kubectl create -f nv_exporter.yml
Create configMap for Prometheus scrape_configs.
$ kubectl create cm prometheus-cm --from-file prom-config.yml
Start Prometheus pod and service.
$ kubectl create -f prometheus.yml
- Start Grafana container. "docker run" example,
$ sudo docker run -d -p 3000:3000 --name grafana grafana/grafana
- After deployed Grafana, open browser and go to: [grafana_host:3000] (example: localhost:3000)
- Login and add Prometheus data source from Configurations -> Data Sources
- find the
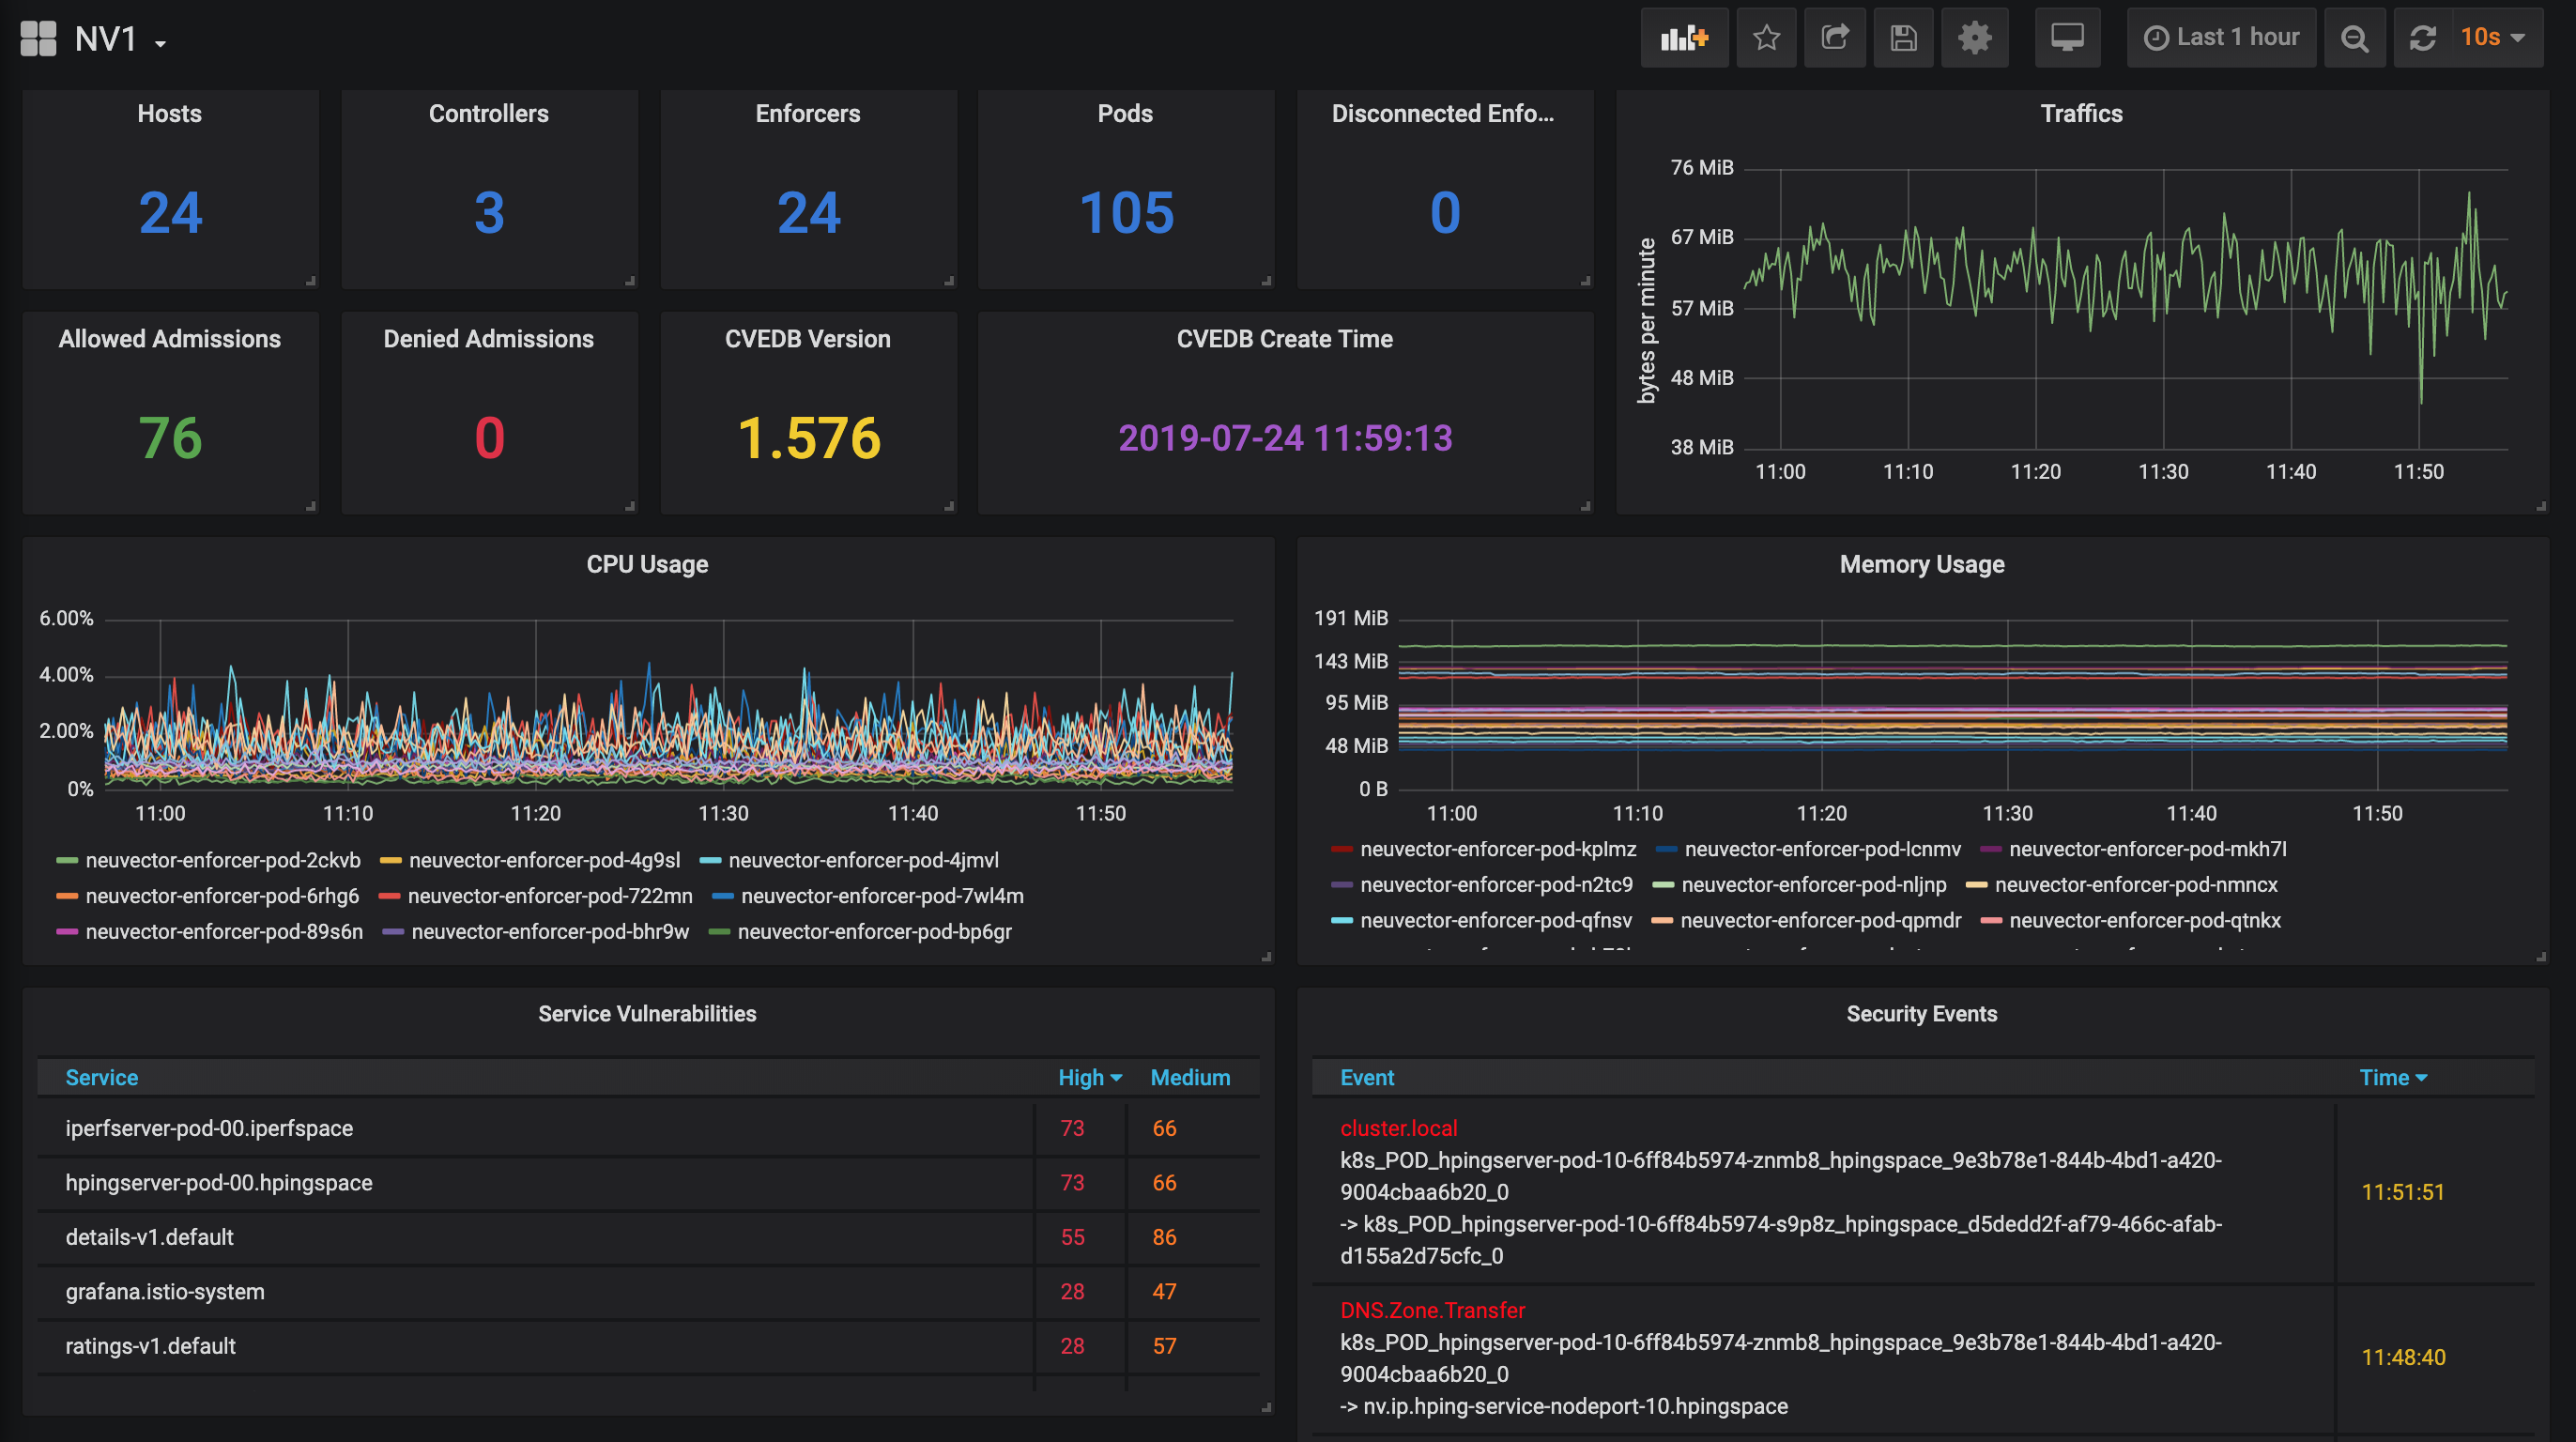
+on the left bar, selectImport. Upload NeuVector dashboard templet JSON file.
| Metrics | Comment |
|---|---|
| nv_summary_services | Number of services |
| nv_summary_policy | Number of network policies |
| nv_summary_pods | Number of pods |
| nv_summary_runningWorkloads | Number of running containers |
| nv_summary_totalWorkloads | Total number of containers |
| nv_summary_hosts | Number of hosts |
| nv_summary_controllers | Number of controllers |
| nv_summary_enforcers | Number of enforcers |
| nv_summary_disconnectedEnforcers | Number of disconnected enforcers |
| nv_summary_cvedbTime | Vulnerability database build time |
| nv_summary_cvedbVersion | Vulnerability database version |
| nv_host_memory | Memory usage of nodes (by node id) |
| nv_controller_cpu | CPU usage of controllers (by controller id) |
| nv_controller_memory | Memory usage of controllers (by controller id) |
| nv_enforcer_cpu | CPU usage of enforcers (by enforcer id) |
| nv_enforcer_memory | Memory usage of enforcers (by enforcer id) |
| nv_conversation_bytes | Network bandwidth of applications |
| nv_admission_allowed | Number of allowed admission control requests |
| nv_admission_denied | Number of denied admission control requests |
| nv_image_vulnerabilityHigh | Number of vulnerabilities of high severity (by image id) |
| nv_image_vulnerabilityMedium | Number of vulnerabilities of medium severity (by image id) |
| nv_container_vulnerabilityHigh | Number of vulnerabilities of high severity (by service name) |
| nv_container_vulnerabilityMedium | Number of vulnerabilities of medium severity (by service name) |
| nv_log_events | Lists of security events |
| nv_fed_master | Shows the status of all the connected clusters to the federated master |
| nv_fed_worker | Shows the status of the cluster to the federated master |
