In Ruby 2.1+, ObjectSpace provides information and tools to understand the current state of your application, such as a memory allocation tracer and heap dumper for static analysis.
Heap Dump
require 'objspace'

GC.start
open("/tmp/ruby-heap-#{Time.now.strftime('%s')}.dump", "w") do |io|
  ObjectSpace.dump_all(output: io)
end
Top 10 Object Count
ObjectSpace.each_object.inject(Hash.new 0) { |h,o| h[o.class] += 1; h }.sort_by { |k,v| -v }.take(10).each { |klass, count| puts "#{count.to_s.ljust(10)} #{klass}" }- Ruby 2.1: objspace.so
- What’s Happening in Your Ruby Application?
- Demystifying the Ruby GC
- Watching and Understanding the Ruby 2.1 Garbage Collector at Work
The rbtrace gem is a general ruby process introspection gem, designed to provide insight into running ruby processes. It can be used for various live debugging and heap dumping of a live ruby process.
- For a quick overview of rbtrace: How to Debug Ruby Performance Problems in Production
- Debugging memory leaks in Ruby
Dump the heap for a running process using rbtrace. Note: ensure your process has required rbtrace first.
bundle exec rbtrace -p 6552 -e 'Thread.new{GC.start;require "objspace";io=File.open("/tmp/ruby-heap-#{Time.now.strftime("%s")}.json", "w"); ObjectSpace.dump_all(output: io); io.close}'0.3 Homebrew
0.4 Xcode
Setup to capture your process's heap information
1.1 Add rbtrace to your Gemfile
gem 'rbtrace'The process to be monitored will need to be restarted so that rbtrace is attached.
1.2 Save heap dumps at various intervals
bundle exec rbtrace -p 6552 -e 'Thread.new{GC.start;require "objspace";io=File.open("/tmp/ruby-heap-#{Time.now.strftime("%s")}.json", "w"); ObjectSpace.dump_all(output: io); io.close}'1.3 Copy the heap file(s)
cp <heap_files> heap_files/2.1 Install the required dependencies
brew bundleand
bundle install2.2 Create the database
bundle exec createdb.rb2.3 Import the heap files
bundle exec gencsv.rbsh genimport.sh | psql mem_analysisNow that the database is loaded, we're ready to analyze the information. To find out what is causing a memory leak, we can look at graphs plotting memory usage over time in different dimensions. This is done by graph.rb. Let's start with the object type.
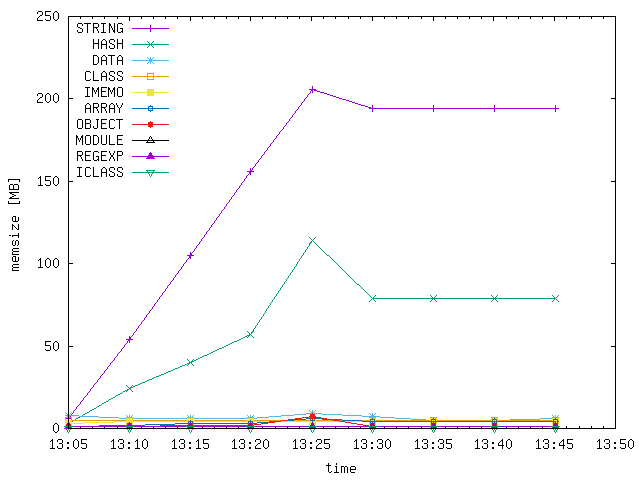
bundle exec graph.rb type-mem; open graph-type-mem.pngThis will create the file graph-type-mem.png showing the total size of objects by type. If there's one thing leaking, you'll probably have a number of somewhat flat lines, and one with a positive slope, which is the culprit.
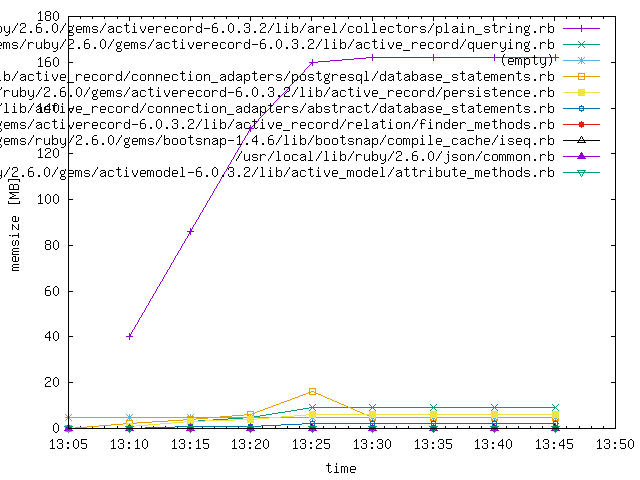
Then create a similar graph for that object type only, and plot lines by file, for example. This gives one an idea in which gem the leaking objects may be created. If it's a string, run
bundle exec ruby graph.rb string-mem; open graph-string-mem.png
If it's something else, edit graph.rb and expand the case-block. In this way you may be able to zoom in on the cause.
Example showing a possible leak of strings:

