Thank you for taking the time to complete this exercise.
This project is to build a simple web page with a form, a table and "bubble" chart to display country data as selected by the user.
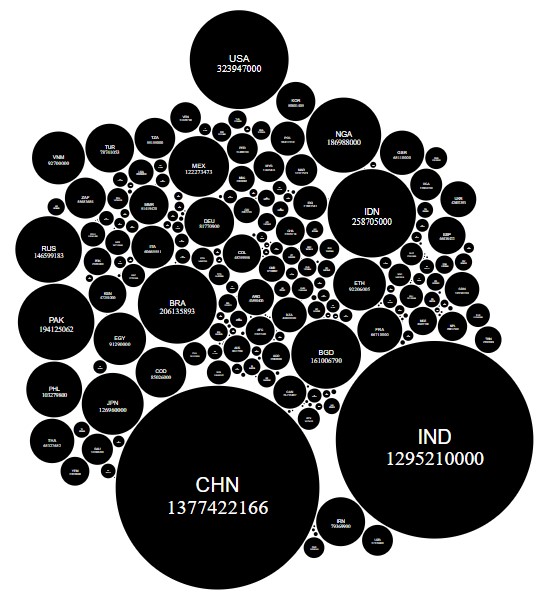
To create the "bubble" chart you can use any suitable library. D3.js will for example plot a chart similar to the following image:
This exercise is to focus on your JavaScript code and not the appearance of the page.
Please clone (don't fork) this repository, complete the exercises below and then upload to a public repository on GitHub and send us the link.
Please don't spend more than 2 hours on this task. If you reach 2 hours, please commit your code as-is to your repository.
The source data for this exercise can be found within this repository at: data/countries.json
On your form please allow the user to select from the following plot options:
By country:
- Population size
- Number of borders
- Number of timezones
- Number of languages
By region:
- Number of countries in the region
- Number of unique timezones in the region
They should only be allowed to pick one plot point at a time, but also be allowed to change their selection and update the chart.
Please create a basic form for the user to make and update their selection, as described above.
Style as you feel appropriate, you may use any library to assist.
Plot the selected criteria on a "bubble" chart.
Underneath the chart display the same data as shown in the chart in a table.
When hovering over a bubble display a pop-up with more information about that country/region from the JSON data.
