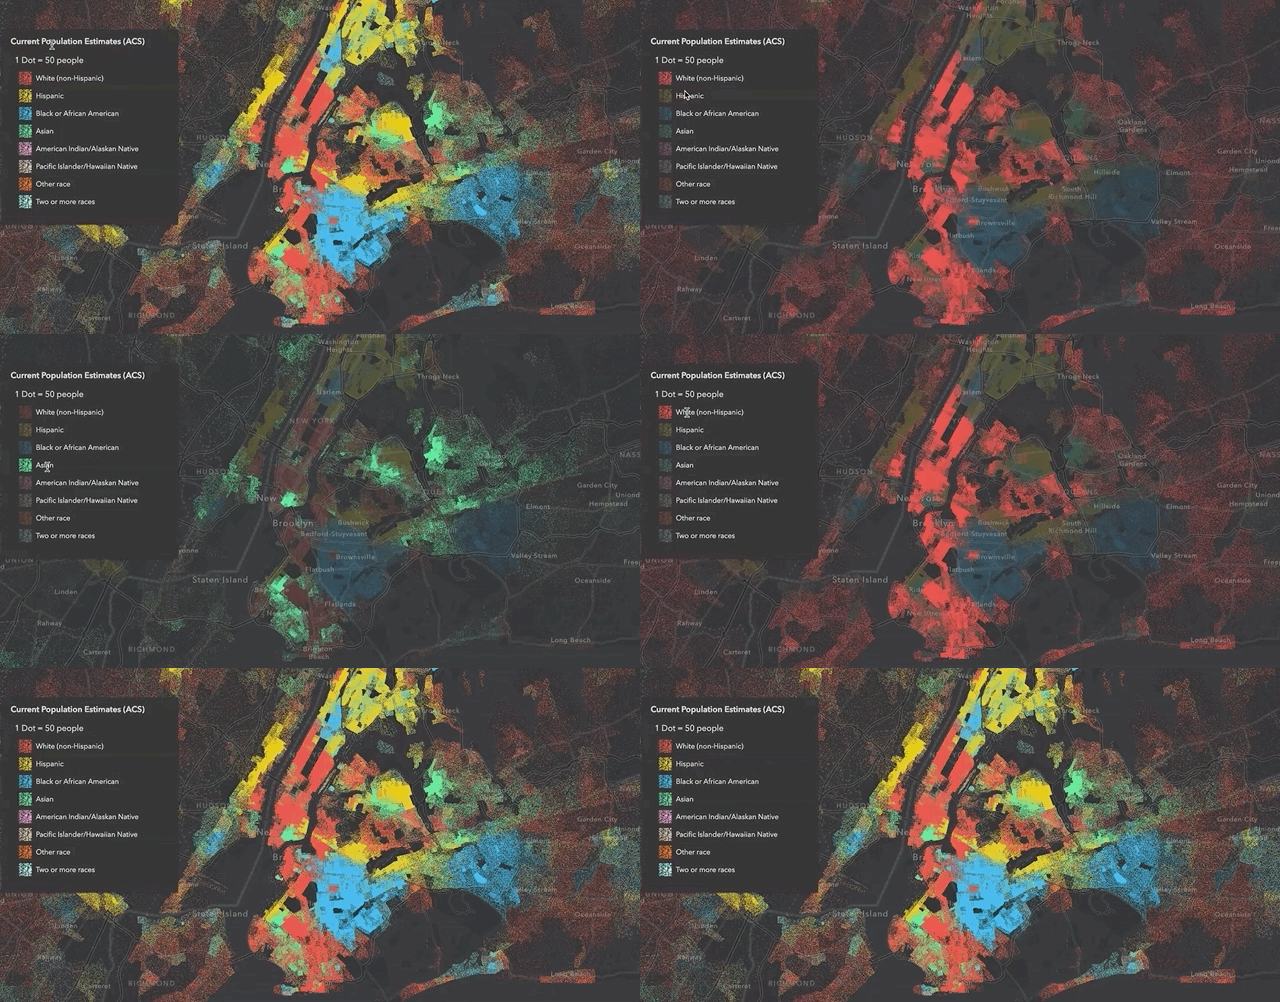
This app visualizes U.S. population by Census Tract using Dot Density. Each dot represents 800 people at the initial scale of the map. As you zoom, the dot value dynamically updates to maintain the same visual density across scale. Color is used to map population of different races. Move the cursor over the legend to emphasize the population distribution of one race at a time.
Read the following blog to learn more about how this app was created: Interactive dot density maps for the web.
This app demonstrates the following capabilities.
DotDensityRenderer is used to visualize population density by assigning a population value to each dot. The dot value varies by scale. See DotDensityRenderer for more details.
The ArcGIS JS API renders all data using WebGL. This allows the API to update visualizations quickly for enhanced user experiences. See the Animate opacity visual variable sample for more details.
The user can explore individual categories of data by interacting with Legend elements. See the Legend API reference for more details.
The data in this app is rendered using dynamic feature tiles. This means we can render the data quickly without cooking it. It can be queried, highlighted, and analyzed. This app loads thousands of features quickly, but also allows the user to interact with it via popups. See the documentation of the PopupTemplate API reference for more details.
- Fork and then clone the repo.
- Run and try the sample.
- Notepad or your favorite HTML editor
- Web browser with access to the Internet
Find a bug or want to request a new feature? Please let us know by submitting an issue.
This demo application is for illustrative purposes only and it is not maintained. There is no support available for deployment or development of the application.
Esri welcomes contributions from anyone and everyone. Please see our guidelines for contributing.
Copyright 2019 Esri
Licensed under the Apache License, Version 2.0 (the "License"); you may not use this file except in compliance with the License. You may obtain a copy of the License at
http://www.apache.org/licenses/LICENSE-2.0
Unless required by applicable law or agreed to in writing, software distributed under the License is distributed on an "AS IS" BASIS, WITHOUT WARRANTIES OR CONDITIONS OF ANY KIND, either express or implied. See the License for the specific language governing permissions and limitations under the License.
A copy of the license is available in the repository's license.txt file.
