A simple suite of tools that let us report on engineering KPIs out of Jira.
git clone git@github.com:hotjar/jira-analysis.git
python3 -m venv venv
. venv/bin/activate
pip install -r requirements.txt
python setup.py develop
You need to configure your Jira credentials and project config. This is two files:
credentials.yamlfor Jira credentialsconfig.yamlfor your project config
jira_credentials:
    email: your_email@example.com
    token: JIRA_TOKEN
jira_url: <YOUR_COMPANY>.atlassian.netUse this to set your In Progress and Done statuses for each project you want to analyse. This lets you handle customised workflows to get the right charts.
projects:
  PROJECT_KEY:
    key: PROJECT_KEY
    in_progress:
      - In Progress
      - Review
    completed:
      - Done
    analyse_issue_types:
      - Story
      - Bug
      - Experiment
    exclude_issues:
      - PROJECT_KEY-123
    defect_types:
      - Bug
You can configure multiple projects with different settings for In Progress and Completed. Simple add items to the list.
The analyse_issue_types config is optional: use it to set issue types that have fixed or deliberately short times e.g.
toil (that should take less than a day) or spikes (that are fixed lengths of time). This avoids messing up your cycle
time charts.
The exclude_issues option sets the issues to ignore for analysis globally. This is handy for cases where your Jira
stories haven't been maintained cleanly e.g. started then stopped work, then started again later.
First you need to download tickets into a JSON file for analysis:
jira-analysis fetch <PROJECT_KEY> <PROJECT_KEY>.json -c credentials.yaml
Once this is done, you can analyse the tickets:
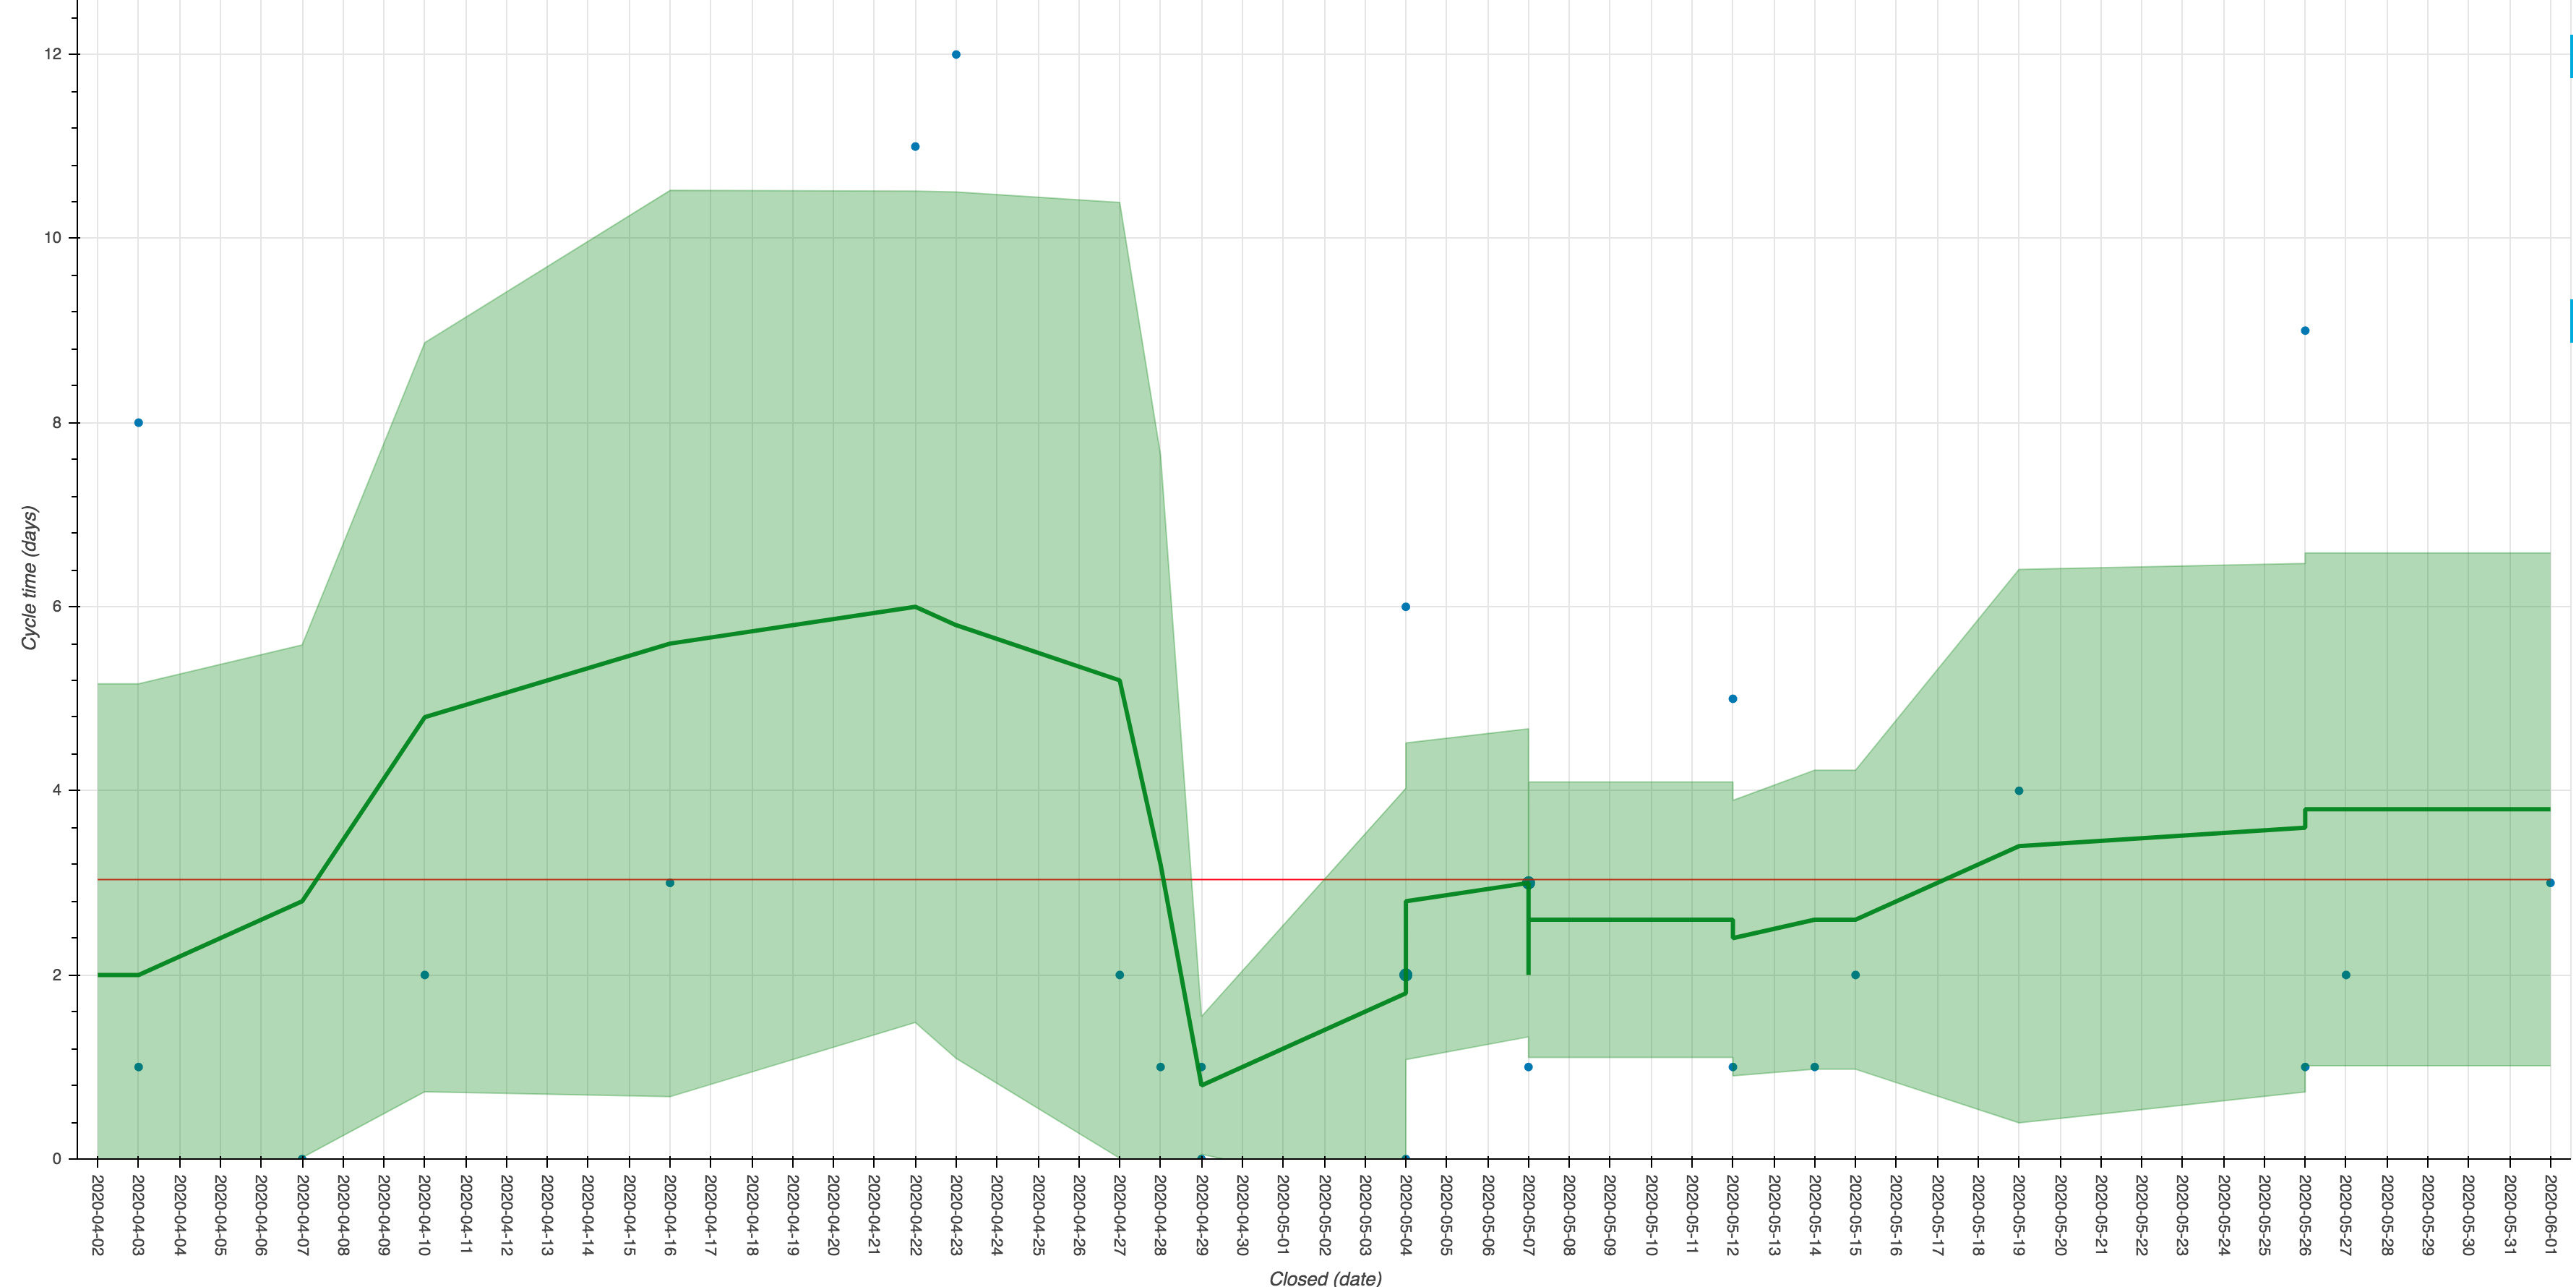
# Build a cycle time chart
jira-analysis cycle-time <PROJECT_KEY> <PROJECT_KEY>.json -c config.yaml
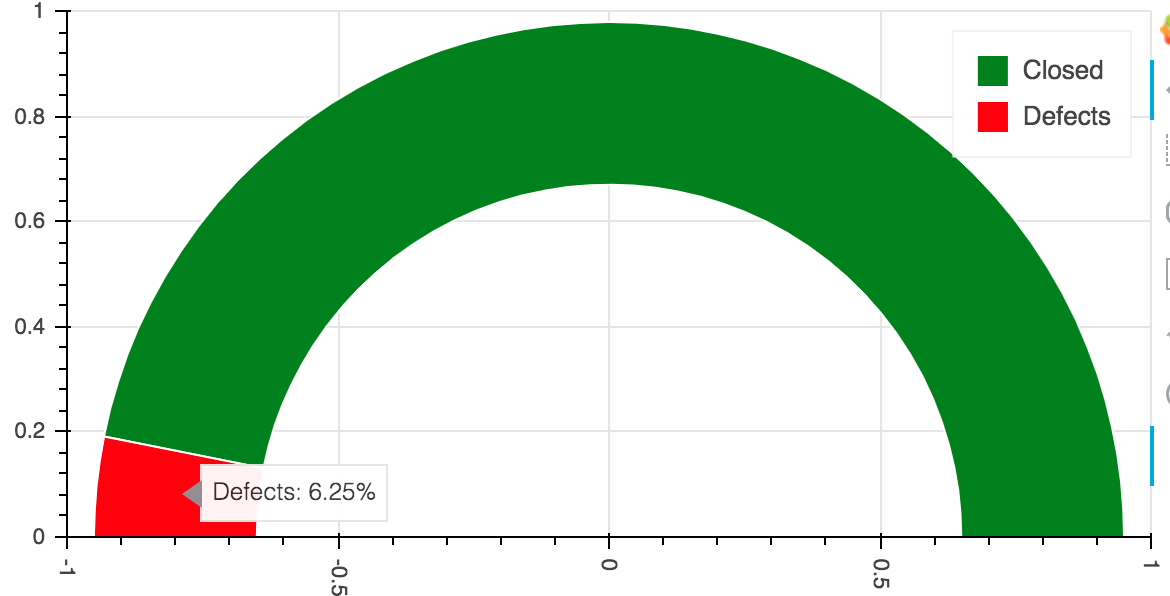
# Build a defect rate plot
jira-analysis defect-rate <PROJECT_KEY> <PROJECT_KEY>.json -c config.yaml
Note the -c argument that points to the credentials.yaml file you created for Jira and the config.yaml file for
analysis.
Jira is ridiculously customisable, to the point where it doesn't always easily support the reporting that you need in the format that you have. Most of the time, people resolve this by dumping data into Excel and building custom charts and reports.
The purpose of this is to work directly with Jira's API, which gives a lot more rich data, allowing us to get the reports we want with minimal manual exporting, copying and pasting.

