This project has been conducted under the supervision of Dr. Jinoh Kim and Dr. Donghwoon Kwon at Texas A&M University-Commerce. The research outcome will be published in the proceeding of IEEE ICNC 2018, with the title of “An Empirical Evaluation of Deep Learning for Network Anomaly Detection”.
- Below results are for NSL-KDD Dataset only. Master branch contains code for NSL-KDD dataset. There are separate dev branches for Kyoto University and Mawii labs. The networks implemented are same for all datasets.
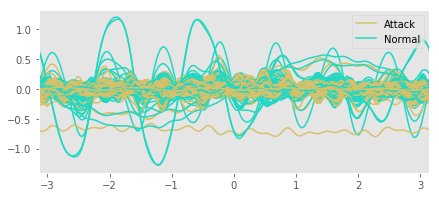

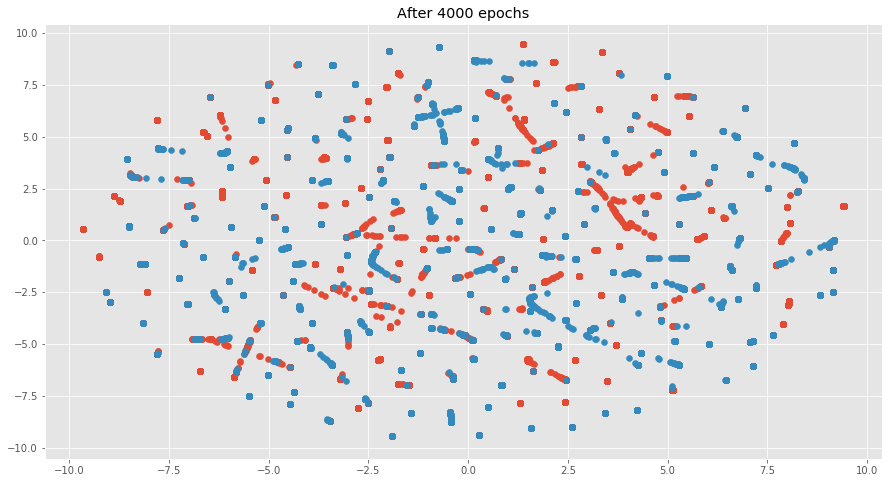
|
|
|
Accuracy |
F1 Score |
Precision |
Recall |
| Model |
Scenarios |
Number of Features |
|
|
|
|
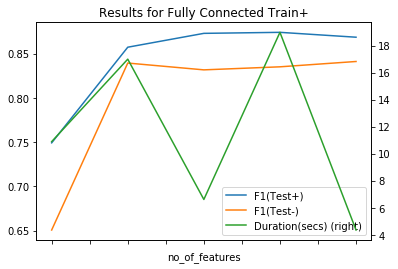
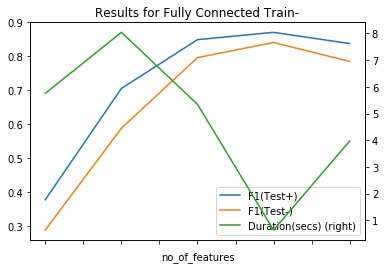
| Fully Connected |
Train+_Test+ |
48 |
0.8670 |
0.8739 |
0.9490 |
0.8098 |
| Train+_Test- |
48 |
0.7576 |
0.8350 |
0.9424 |
0.7495 |
| Train-_Test+ |
48 |
0.8561 |
0.8695 |
0.8988 |
0.8420 |
| Train-_Test- |
48 |
0.7504 |
0.8396 |
0.8856 |
0.7981 |
|
|
|
Accuracy |
F1 Score |
Precision |
Recall |
| Model |
Scenarios |
Number of Features |
|
|
|
|
| VAE-Softmax |
Train+_Test+ |
122 |
0.8948 |
0.9036 |
0.9441 |
0.8665 |
| Train+_Test- |
122 |
0.8173 |
0.8814 |
0.9402 |
0.8296 |
| Train-_Test+ |
48 |
0.7195 |
0.6942 |
0.9151 |
0.5592 |
| Train-_Test- |
48 |
0.8015 |
0.8700 |
0.9373 |
0.8118 |
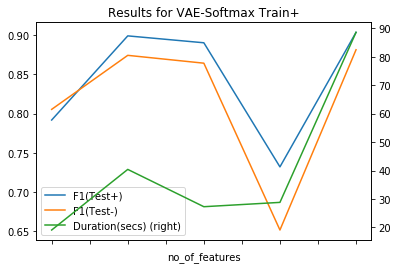
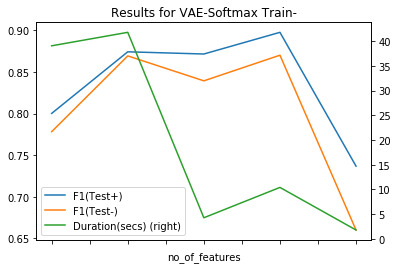
Network learns to regenerated labels treating it as missing data during testing.
|
|
|
Accuracy |
F1 Score |
Precision |
Recall |
| Model |
Scenarios |
Number of Features |
|
|
|
|
| VAE-GenerateLabels |
Train+_Test+ |
1 |
0.5692 |
0.7255 |
0.5692 |
1.0 |
| Train+_Test- |
1 |
0.8184 |
0.9001 |
0.8184 |
1.0 |
| Train-_Test+ |
1 |
0.5692 |
0.7255 |
0.5692 |
1.0 |
| Train-_Test- |
1 |
0.8184 |
0.9001 |
0.8184 |
1.0 |
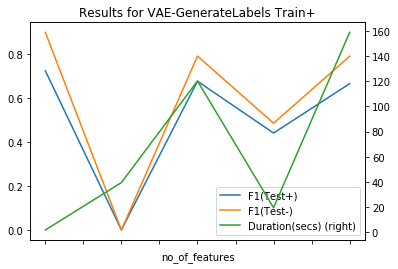
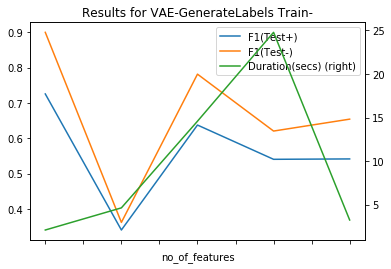
Softmax layer is used to convert output sequence to Normal/Anomaly prediction.
|
|
|
Accuracy |
F1 Score |
Precision |
Recall |
| Model |
Scenarios |
Number of Features |
|
|
|
|
| LSTM Seq2Seq |
Train+_Test+ |
1 |
0.9949 |
0.9955 |
0.9915 |
0.9995 |
| Train+_Test- |
1 |
0.9949 |
0.9955 |
0.9915 |
0.9995 |
| Train-_Test+ |
1 |
0.9992 |
0.9993 |
0.9985 |
1.0000 |
| Train-_Test- |
1 |
0.9992 |
0.9993 |
0.9985 |
1.0000 |
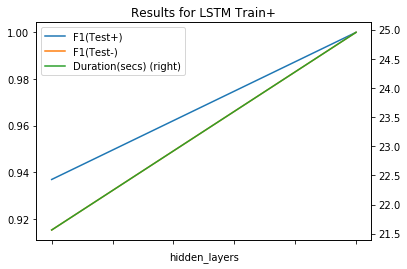
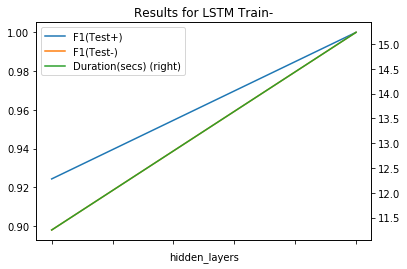
| Model |
Fully Connected |
LSTM |
VAE-GenerateLabels |
VAE-Softmax |
| Scenarios |
|
|
|
|
| Train+_Test+ |
0.8739 |
0.9955 |
0.7255 |
0.9036 |
| Train+_Test- |
0.8350 |
0.9955 |
0.9001 |
0.8814 |
| Train-_Test+ |
0.8695 |
0.9993 |
0.7255 |
0.6942 |
| Train-_Test- |
0.8396 |
0.9993 |
0.9001 |
0.8700 |

| Scenarios |
Train+_Test+ |
Train+_Test- |
Train-_Test+ |
Train-_Test- |
| Model |
|
|
|
|
| Fully Connected |
0.8739 |
0.8350 |
0.8695 |
0.8396 |
| LSTM |
0.9955 |
0.9955 |
0.9993 |
0.9993 |
| VAE-GenerateLabels |
0.7255 |
0.9001 |
0.7255 |
0.9001 |
| VAE-Softmax |
0.9036 |
0.8814 |
0.6942 |
0.8700 |


