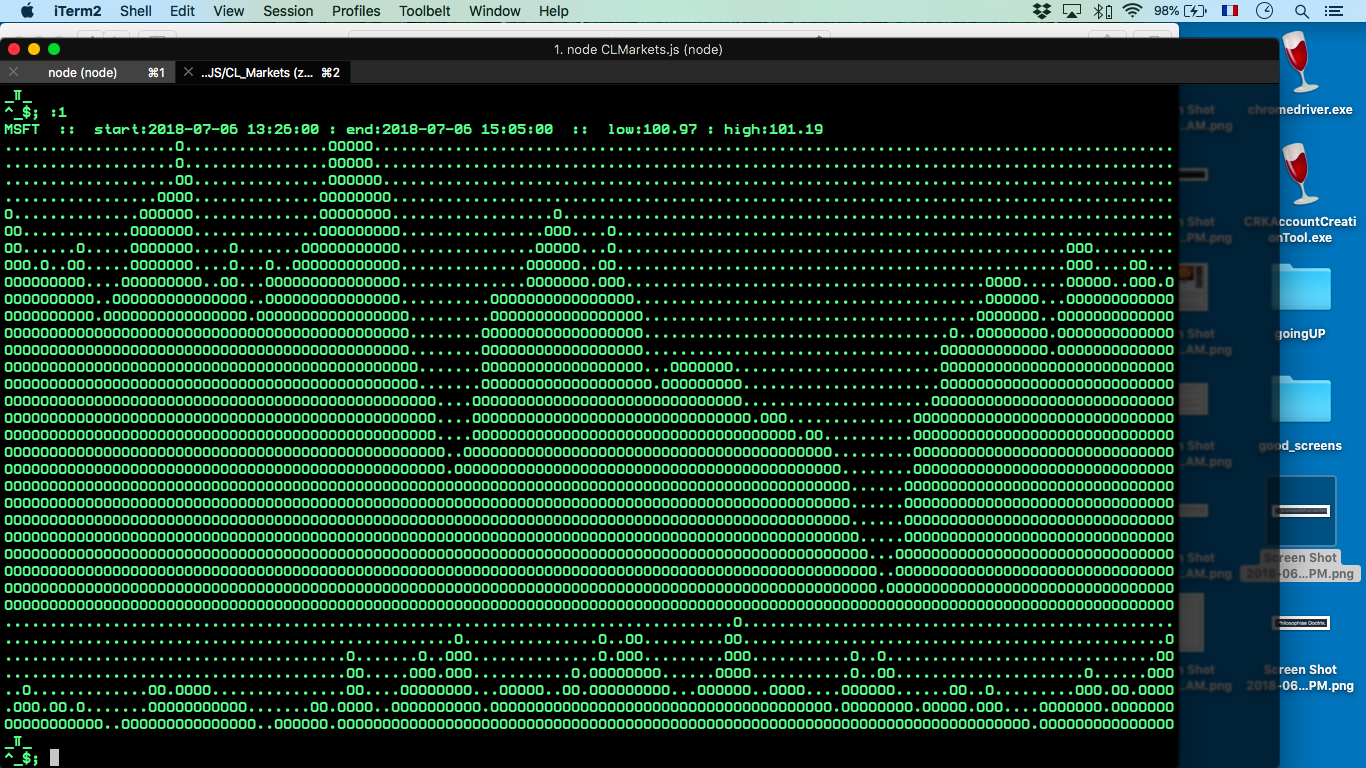
a node.js command line tool to view charts from stocks, crypto currencies, and currency spot data
an API key can be requested at this adress: https://www.alphavantage.co/support/#support
documentation can be found here: https://www.alphavantage.co/documentation/
PLEASE READ ALPHA VANTAGE's TERMS AND CONDITIONS AND ADHERE TO THEIR GUIDELINES ESPECIALLY REGARDING FREQUENCY OF API CALLS
there are ways to obtain high volume data streams but these must be negotiated with Alpha Vantage
3) In the file named 'api_key.js' replace YOURAPIKEY with your api key obtained from https://www.alphavantage.co/support/#support
as outlined in the REQUIREMENTS section above
you should be in the interactive REPL (read-evaluate-print-loop) of the program
hit <ENTER> or enter one of the following commands. all commands must be prefixed by one of the following symbols:
-$stock ($RHT, $F, $QQQ)
-¢crypto (¢eth, ¢btc/eur)
-£currency/pair (£usd/gbp, £cad,jpy)
-:interval (:1,:5,:15,:30,:60,:i,:d,:w,:m)
-#type (#line, #bar, #ohlc)
-$GOOG :15 #bar --> produces a bar graph of GOOG with ~15 min intervals
-:30 --> produces a bar graph of GOOG with ~30 min intervals
-:m #ohlc --> produces an ohlc (open high low close) graph of GOOG in monthly intervals
-$AMZN #line --> produces a line graph of AMZN in monthly intervals
-¢btc/eur --> produces an ohlc graph of btc vs eur
-£cad/gbp --> returns spot price for currency pair (pairs must be in proper one/two format)
