Tools to monitor, analyze and visualize File-I/O.
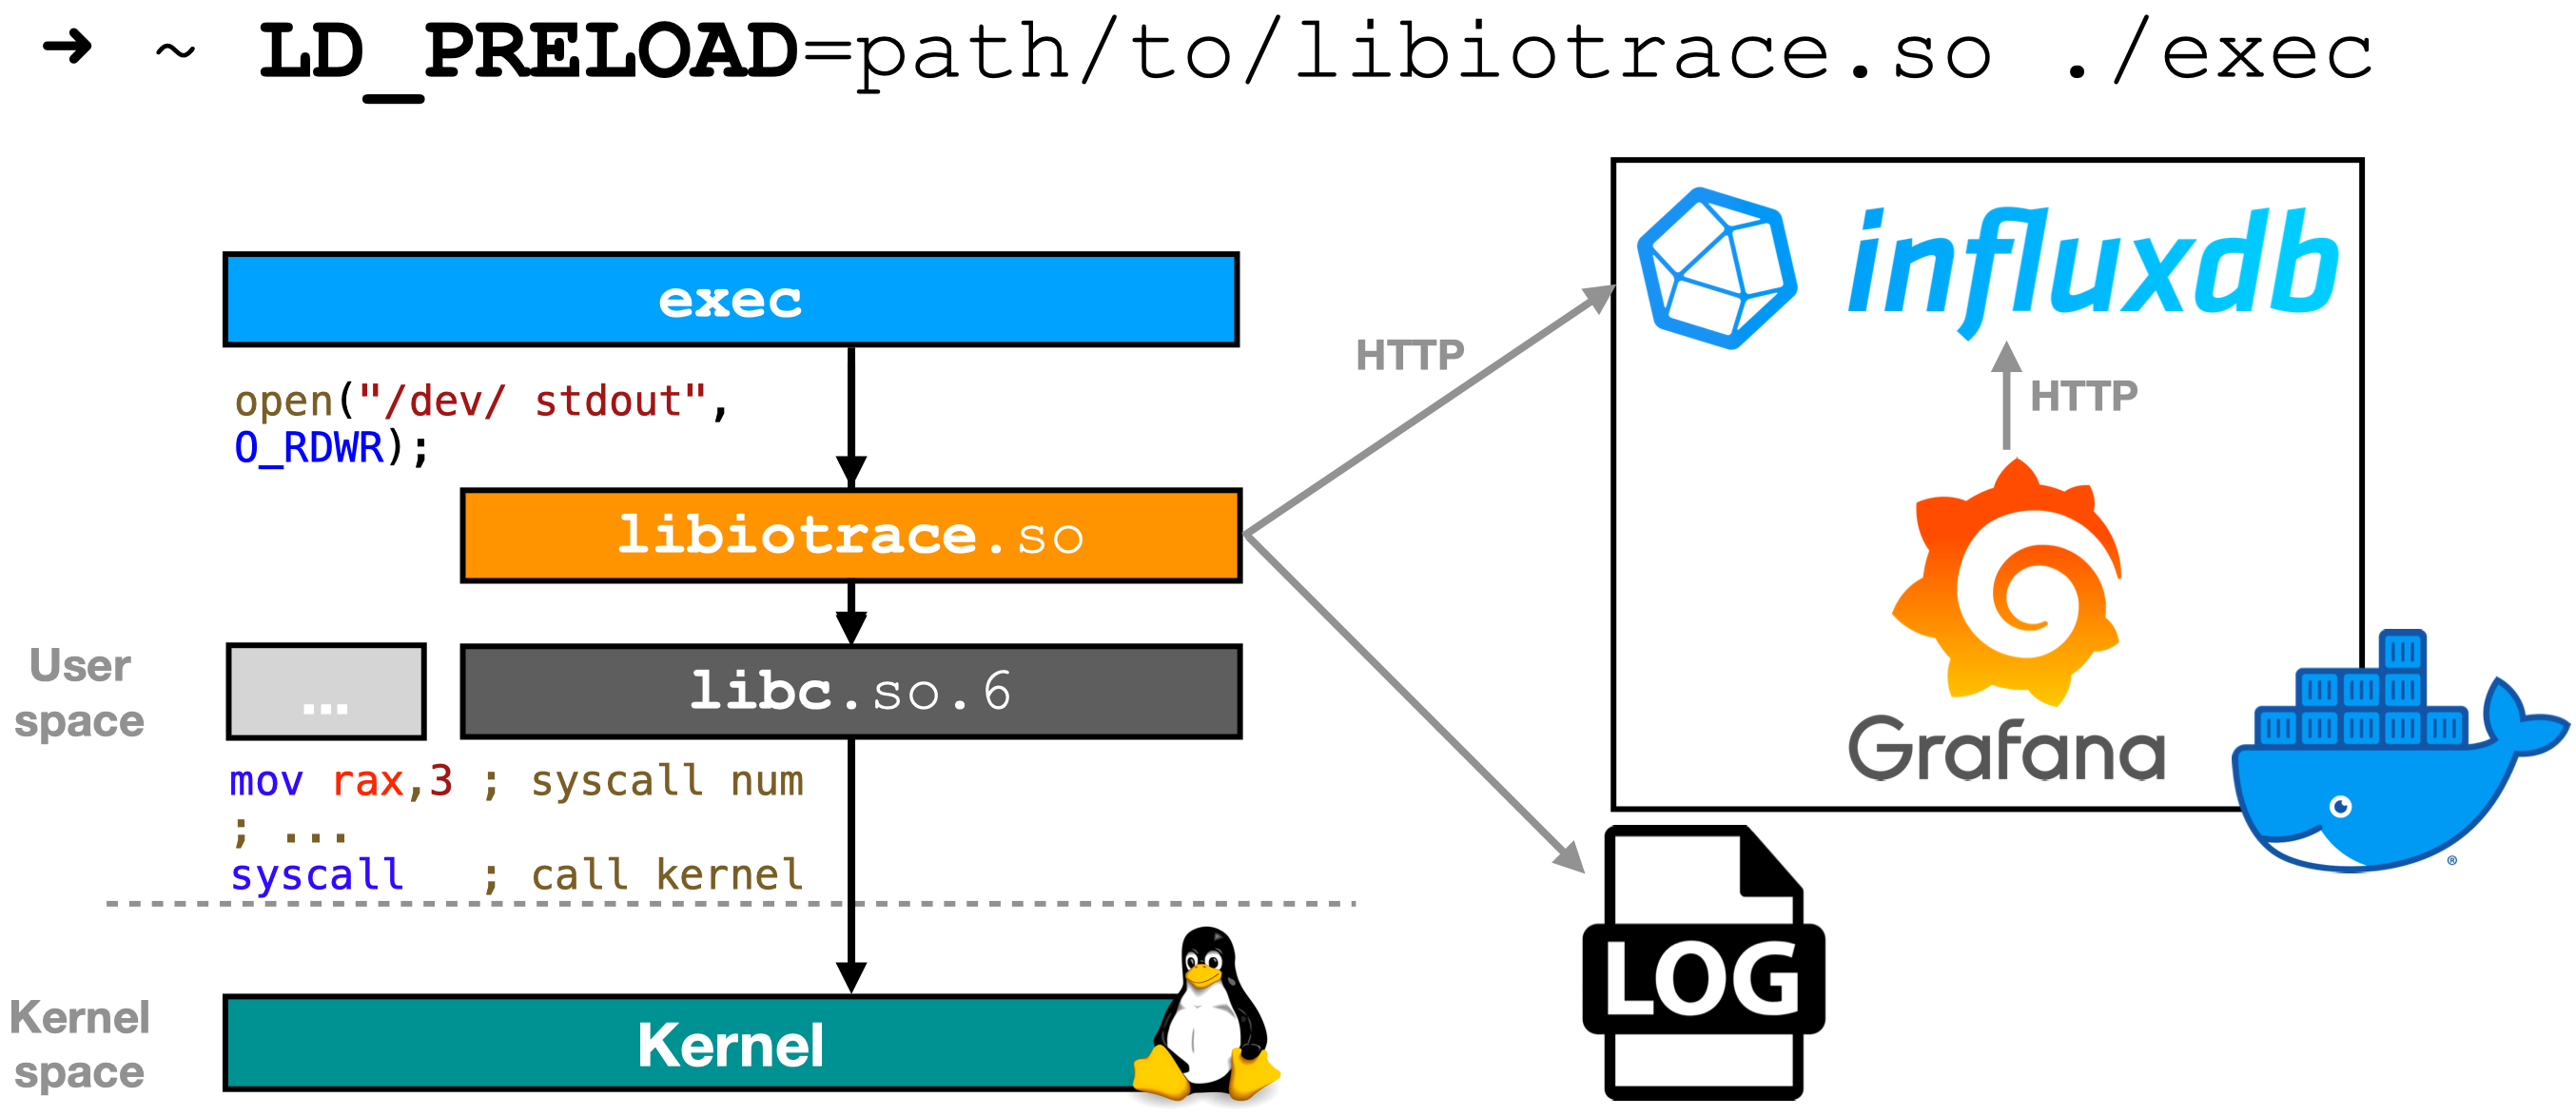
libiotrace is a tool for monitoring a running dynamically linked program without the need for changing it. During a monitored run detailed data for many File-I/O related function calls is collected. The collected data is written to log files.
libiotrace is currently only available for GNU/Linux-Systems. It has been tested with Red Hat Enterprise Linux Server release 7.7, KDE neon User Edition 5.18 release 18.04 and Ubuntu 22.04 LTS.
To build libiotrace on your system you need a C/C++-Compiler, make, CMake and optionally ccmake.
BSD 3-Clause
3rd party libraries:
- llhttp source: MIT License
- CUnit (GNU LIBRARY GENERAL PUBLIC LICENSE Version 2, see CUnit)
CMake and ccmake: OSI-approved BSD 3-Clause License (see CMake)
CUnit: GNU LIBRARY GENERAL PUBLIC LICENSE Version 2 (see CUnit)
- Steps to build libiotrace:
-
open terminal
-
go to <libiotrace-folder>
-
cd fsprj2/libiotrace/ -
git rm --cached test/ext/cunit -
rm -rf test/ext/cunit -
cd .. -
git submodule add https://gitlab.com/cunity/cunit.git libiotrace/test/ext/cunit -
cd libiotrace/ -
mkdir build(for out of source build) -
cd build/ -
ccmake ..(if you want to use cmake instead of ccmake typecmake ..instead ofccmake .., set options with -D<option> and continue with stepmake) -
press “c” and wait until configuration is done
-
optional: customize libiotrace (set/change cmake options)
-
BUFFER_SIZE:
libiotrace buffers output in one buffer per monitored process. This option sets the buffer size in bytes. A bigger buffer reduces the overhead of libiotrace. But a bigger buffer means also reduced available memory for the monitored program and the system.
-
FILENAME_RESOLUTION_ENABLED:
Disclaimer: This feature requires depending on chosen HASH_FUNCTION either SSE4.2 support (for CITY3HASH_128) or the library
libssl-dev(for MD5HASH). Also, some POSIX-/MPI-IO functions are currently not supported.If set to ON libiotrace will create a mapping between filenames and file handles (e.g., fildes) during runtime and write the traced filenames to the trace. Supports by default up to 100 open files. This limit can be raised to max. 10000 using the environment variable IOTRACE_FNRES_MAX_FILENAMES. Note: This mapping can also be created post-mortem using the tool IOTrace_Analyze.
WARNING: Might affect async-signal safety of functions which open/close files (affects mostly functions which aren't async-signal safe from the get-go)
-
LOGGING:
If set to ON detailed data is collected and written to output files. If set to OFF nothing is collected. Setting this option to OFF is only useful together with using the libiotrace.h (see Use libiotrace).
-
LOG_WRAPPER_TIME:
If set to ON the time needed for collecting and writing the data is written to the output. In that case the overhead of libiotrace can be included in further analysis.
-
MAX_ERROR_TEXT:
For functions which use the lvalue errno to return error values libiotrace collects the error value and a corresponding error text. This option sets the maximum length of this text. Longer values are truncated.
-
MAX_EXEC_ARRAY_LENGTH:
If the monitored program is dynamically linked and calls a exec-function the environment variable LD_PRELOAD must be set for the new process (see Use libiotrace for LD_PRELOAD). To ensure this all in the parameters of the exec function given environment variables have to be inspected and in some cases changed. The maximum number of inspected variables is set with this option.
-
MAX_FUNCTION_NAME:
Sets the maximum length of collected function names. Longer names get truncated.
-
MAX_INFLUX_TOKEN:
Sets the maximum length for the InfluxDB token.
-
MAX_MMSG_MESSAGES:
If the monitored program sends or receives multiple messages via call of function sendmmsg or recvmmsg this option sets the maximum count of collected messages in a single function call.
-
MAX_MSG_FILE_DESCRIPTORS:
If the monitored program uses Unix Domain Sockets to send File Descriptors from one process to another process this option sets the maximum count of collected File Descriptors in a single send or receive message.
-
MAX_STACKTRACE_DEPTH:
This option sets the maximum depth of an collected stack trace (the maximum number of inspected stack frames). A stack trace for each monitored function call is only collected if the option STACKTRACE_DEPTH is set to a number greater than 0 and at least one of the options STACKTRACE_PTR and STACKTRACE_SYMBOL is set to ON or a corresponding function from libiotrace.h (see Use libiotrace) is used.
-
MAX_STACKTRACE_ENTRY_LENGTH:
Sets maximum length of a single entry in a collected stack trace. Longer values are truncated.
-
PORT_RANGE_MAX:
When Live-Tracing is enabled wrappers can be enabled and disabled remotely at runtime per process. To receive the control information libiotrace has to use a port per process. This is the maximum port value for that libiotrace tries to get a port.
-
PORT_RANGE_MIN:
When Live-Tracing is enabled wrappers can be enabled and disabled remotely at runtime per process. To receive the control information libiotrace has to use a port per process. This is the minimum port value for that libiotrace tries to get a port.
-
SENDING:
When set to ON each wrapper sends its data live to InfluxDB. Please look in section Live-Tracing which parameters are required to send data to InfluxDB.
-
STACKTRACE_DEPTH:
Sets the maximum number of currently collected stack trace entries. If the current stack trace is deeper than STACKTRACE_DEPTH entries will be omitted. The value of STACKTRACE_DEPTH has to be less than or equal to the value of MAX_STACKTRACE_DEPTH. STACKTRACE_DEPTH can be changed during the run of the monitored program if libiotrace.h is used see Use libiotrace.
-
STACKTRACE_PTR:
If set to ON and STACKTRACE_DEPTH is greater than 0 the memory address of stack trace entries is collected. WARNING: Might affect async-signal safety of traced functions
-
STACKTRACE_SYMBOL:
If set to ON and STACKTRACE_DEPTH is greater than 0 the symbol name of stack trace entries is collected. WARNING: Might affect async-signal safety of traced functions
-
STRACING_ENABLED:
Prerequisites: Linux kernel sources (for Debian based systems:
sudo apt source linux; NOTE:deb-srclines in apt-sources may need to be uncommented first), dependencies: libunwind and libdwfl (on Debian based systems:sudo apt install -y libunwind-dev libdw-dev)If set to ON, libiotrace will launch an additional process, "the stracer", which uses ptrace(2) to trace the program traced by libiotrace, "the tracee". This enables libiotrace to indirectly trace library calls, which cannot be traced by libiotrace itself, e.g., due to static linkage.
-
WITH_DL_IO:
If set to ON functions from dlfcn.h are monitored (namely dlopen and dlmopen).
-
WITH_MPI_IO:
If set to ON functions from mpi_io.c are monitored
-
WITH_POSIX_AIO:
If set to ON functions from aio.h (POSIX Asynchronous Input and Output) are monitored (namely aio_read, aio_read64, aio_write, aio_write64, lio_listio, lio_listio64, aio_error, aio_error64, aio_return, aio_return64, aio_fsync, aio_fsync64, aio_suspend, aio_suspend64, aio_cancel, aio_cancel64, aio_init and shm_open). IOTrace_Analyze (see IOTrace_Analyze) doesn't analyze these functions. This will be implemented in the future.
-
WITH_POSIX_IO:
If set to ON functions from dirent.h, fcntl.h, stdio.h, stdio_ext.h, stdlib.h, sys/epoll.h, sys/eventfd.h, sys/inotify.h, sys/memfd.h, sys/mman.h, sys/select.h, sys/socket.h, sys/uio.h, unistd.h and wchar.h are monitored (for a complete list of functions see <libiotrace-folder>/fsprj2/libiotrace/src/posix_io.h).
-
WITH_STD_IO:
If set to ON functions calls which work with a File Descriptor equal to STDIN_FILENO, STDOUT_FILENO or STDERR_FILENO and functions which work with a file stream equal to stdin, stdout or stderr will be monitored. So if set to OFF, for such function calls no data will be collected. This can be a problem in IOTrace_Analyze. If for example the File Descriptor STDOUT_FILENO is duplicated with an call to the dup2 function and the resulting duplicate is not equal to STDIN_FILENO or STDERR_FILENO the output analysis in IOTrace_Analyze will be wrong. Thats the case because the original File Descriptor and the call of the dup2 function are not collected but the new File Descriptor and function calls with this new File Descriptor are collected. With this data the IOTrace_Analyze is not able to get the correct file for the monitored function calls. The new File Descriptor could be in use with an other file before the call to dup2. So during analysis the following calls to the new File Descriptor will be connected to the file in use before the call of dup2. Which is probably wrong. So if you are not sure if the monitored program manipulates the standard (std) file streams or File Descriptors (e.g. with an redirect of standard file streams during start of an new process) set this option to ON. In any other case you can omit a lot of overhead by setting it to OFF.
-
-
press “c” again (this brings up the option “g” to generate)
-
press “g” and wait until ccmake exits
-
make(wait until build is done) -
libiotrace is now available in folder <libiotrace-folder>/fsprj2/libiotrace/build/src
- libiotrace_shared.so (for dynamically linked programs)
- libiotrace_static.a (for linking against static linked programs)
-
-
dynamically linked program
to monitor the program <monitor-program> use the command
LD_PRELOAD=<libiotrace-folder>/fsprj2/libiotrace/build/src/libiotrace.so IOTRACE_LOG_NAME=<prefix-for-log-names> <monitor-program> -
static linked program
link your program against libiotrace_static.a with ld linker option
-wrapfor each function you want to monitor (complete list of possible functions is available in <libiotrace-folder>/fsprj2/libiotrace/test/CMakeLists.txt) -
using libiotrace.h
to control and manipulate the behavior of libiotrace during a run of the monitored program use the libiotrace.h header. For that you have to change the monitored program. Build against the <libiotrace-folder>/fsprj2/libiotrace/include/libiotrace.h and link against <libiotrace-folder>/fsprj2/libiotrace/build/src/libiotrace.so. Use the functions out of libiotrace.h directly in the source of the monitored program. If the changed monitored program is started with LD_PRELOAD set to a path pointing to libiotrace_shared.so the functions out of libiotrace.h will manipulate the behavior. Otherwise the functions have no effect.
Functions in libiotrace.h:
-
void libiotrace_start_log();
Start logging in actual thread. Useful in combination with the cmake option LOGGING (see Build libiotrace and ccmake). With this function and the option it is possible to monitor only part of a program.
-
void libiotrace_end_log();
End logging in actual thread.
-
void libiotrace_start_stacktrace_ptr();
Start logging of stacktrace pointer in actual thread (if logging is active and stacktrace depth is greater than 0).
-
void libiotrace_end_stacktrace_ptr();
End logging of stacktrace pointer in actual thread.
-
void libiotrace_start_stacktrace_symbol();
Start logging of stacktrace symbols in actual thread (if logging is active and stacktrace depth is greater than 0).
-
void libiotrace_end_stacktrace_symbol();
End logging of stacktrace symbols in actual thread.
-
void libiotrace_set_stacktrace_depth(int depth);
Set stacktrace depth for logging in actual thread to depth. If depth is 0 no stacktrace is logged. depth must be less than or equal to MAX_STACKTRACE_DEPTH (see Build libiotrace and ccmake).
-
int libiotrace_get_stacktrace_depth();
Get current stacktrace depth.
-
The output will be placed in the working direrctory of <monitor-program>. Every generated file has a name beginning with <prefix-for-log-names>.
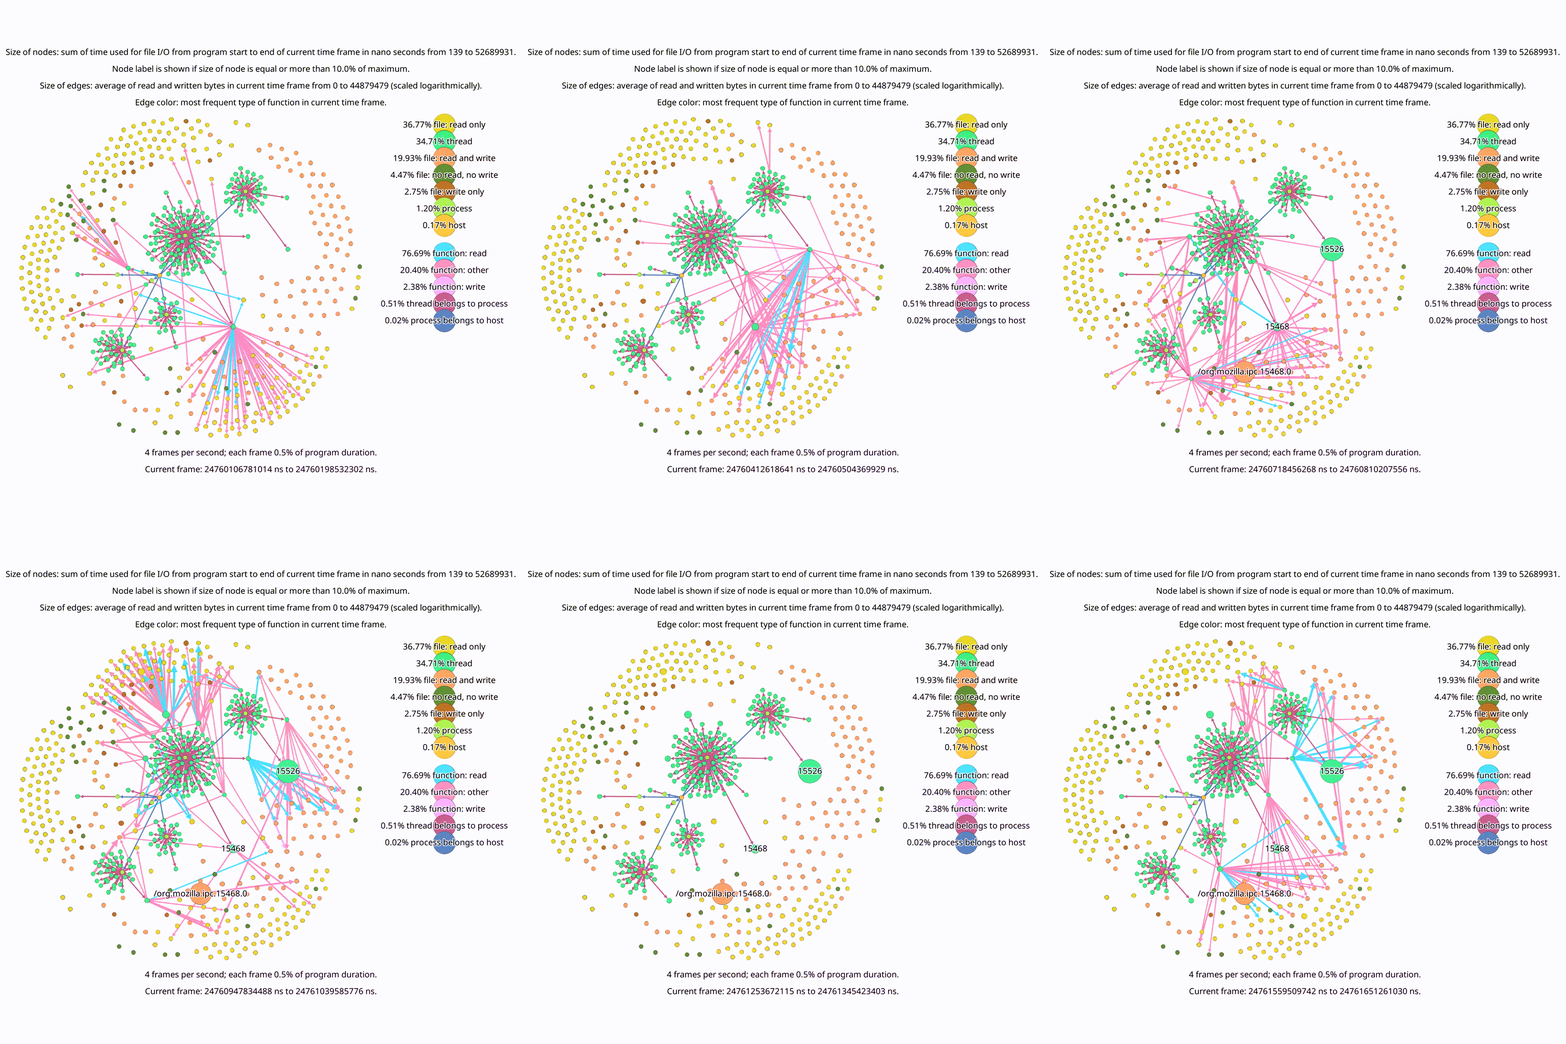
IOTrace_Analyze is used to prepare and analyze the output of libiotrace. This tool reconstructs the sequence of function calls for every thread and every file. It also evaluates the connection between a thread and a file, the time used and the amount of data transported for each function call. The results of this processing are stored in an optimized data model. On the basis of this data model, various graphics are generated. With these graphics, the efficiency of the constellations in the program can be determined. Furthermore, an animation is generated. This animation shows the function calls in a graph over time. The collected and processed data is provided as output files for further analysis. The graphics, the animation and the output files enable improvements of the File-I/O.
To use IOTrace_Analyze a Java Runtime has to be installed. It's tested with java-11-openjdk-amd64 on Ubuntu and jre1.8.0_102 on windows.
Generating the animation is a problem on a headless system. The Gephi Toolkit is used to animate the Graph. Using this toolkit on a headless system will throw a HeadlessException. If you want to run IOTrace_Analyze on a headless system omit the animation. To do this set the entry writeAnimations in the IOTrace_Analyze.properties to false. Alternatively you can do X11 forwarding (use option -X with ssh command) to generate the animations on a headless system.
BSD 3-Clause
Maven: Apache License, Version 2.0 (see Maven)
Gephi Toolkit: CDDL 1.0 and GNU General Public License v3 (see Gephi Toolkit)
Iceberg Charts: Apache License, Version 2.0 (see MVNrepository)
JCodec: FreeBSD License (see JCodec)
JFreeChart: GNU Lesser General Public Licence (see JFreeChart)
JUnit: Eclipse Public License 1.0 (see MVNrepository)
Log4j: Apache License, Version 2.0 (see CMake)
- get the source like described in Build libiotrace step 1 and 2.
- to get the jar you have two options
- build a new jar with maven out of the directory <libiotrace-folder>/fsprj2/IOTrace_Analyze with command
mvn clean install - use the provided snapshot IOTrace_Analyze-0.0.1-SNAPSHOT-jar-with-dependencies.jar in <libiotrace-folder>/fsprj2/IOTrace_Analyze/test/
- build a new jar with maven out of the directory <libiotrace-folder>/fsprj2/IOTrace_Analyze with command
- put the libiotrace output, the IOTrace_Analyze-jar, some log4j2.properties and the IOTrace_Analyze.properties in the same directory. Examples for the properties can be found in <libiotrace-folder>/fsprj2/IOTrace_Analyze/test/.
- it's possible to alternate between different properties by using the command line parameters
-analyzeprop=<path/filename to IOTrace_Analyze.properties>and-log4jprop=<path/filename to log4j2.properties>. If one of these parameters is given the apropriate file is not searched in the same directory. Instead it's loaded with the given filename from the given path.
- it's possible to alternate between different properties by using the command line parameters
- edit the IOTrace_Analyze.properties. At least the entry inputFile has to be changed to the value of <prefix-for-log-names> to find the libiotrace output. The other entrys define which output will be generated.
- each value loaded from IOTrace_Analyze.properties can be overwritten by using a command line parameter.
So e.g. instead of changing the entry inputFile the parameter
-inputFile=<prefix-for-log-names>could be used.
- each value loaded from IOTrace_Analyze.properties can be overwritten by using a command line parameter.
So e.g. instead of changing the entry inputFile the parameter
- run the jar with the command
java -jar <IOTrace_Analyze-jar>(or with more parameters e.g.:java -jar <IOTrace_Analyze-jar> -inputFile=<prefix-for-log-names>; for big log files it's necessary to increase the maximum memory allocation pool for the JVM with an additional parameter like-Xmx16g:java -Xmx16g -jar <IOTrace_Analyze-jar> -inputFile=<prefix-for-log-names>)
If the given properties are used, two new directorys are generated. One with the name logs which includes the file IOTrace_Analyze.log. And one with the name output which includes all generated diagrams, output files and animations.
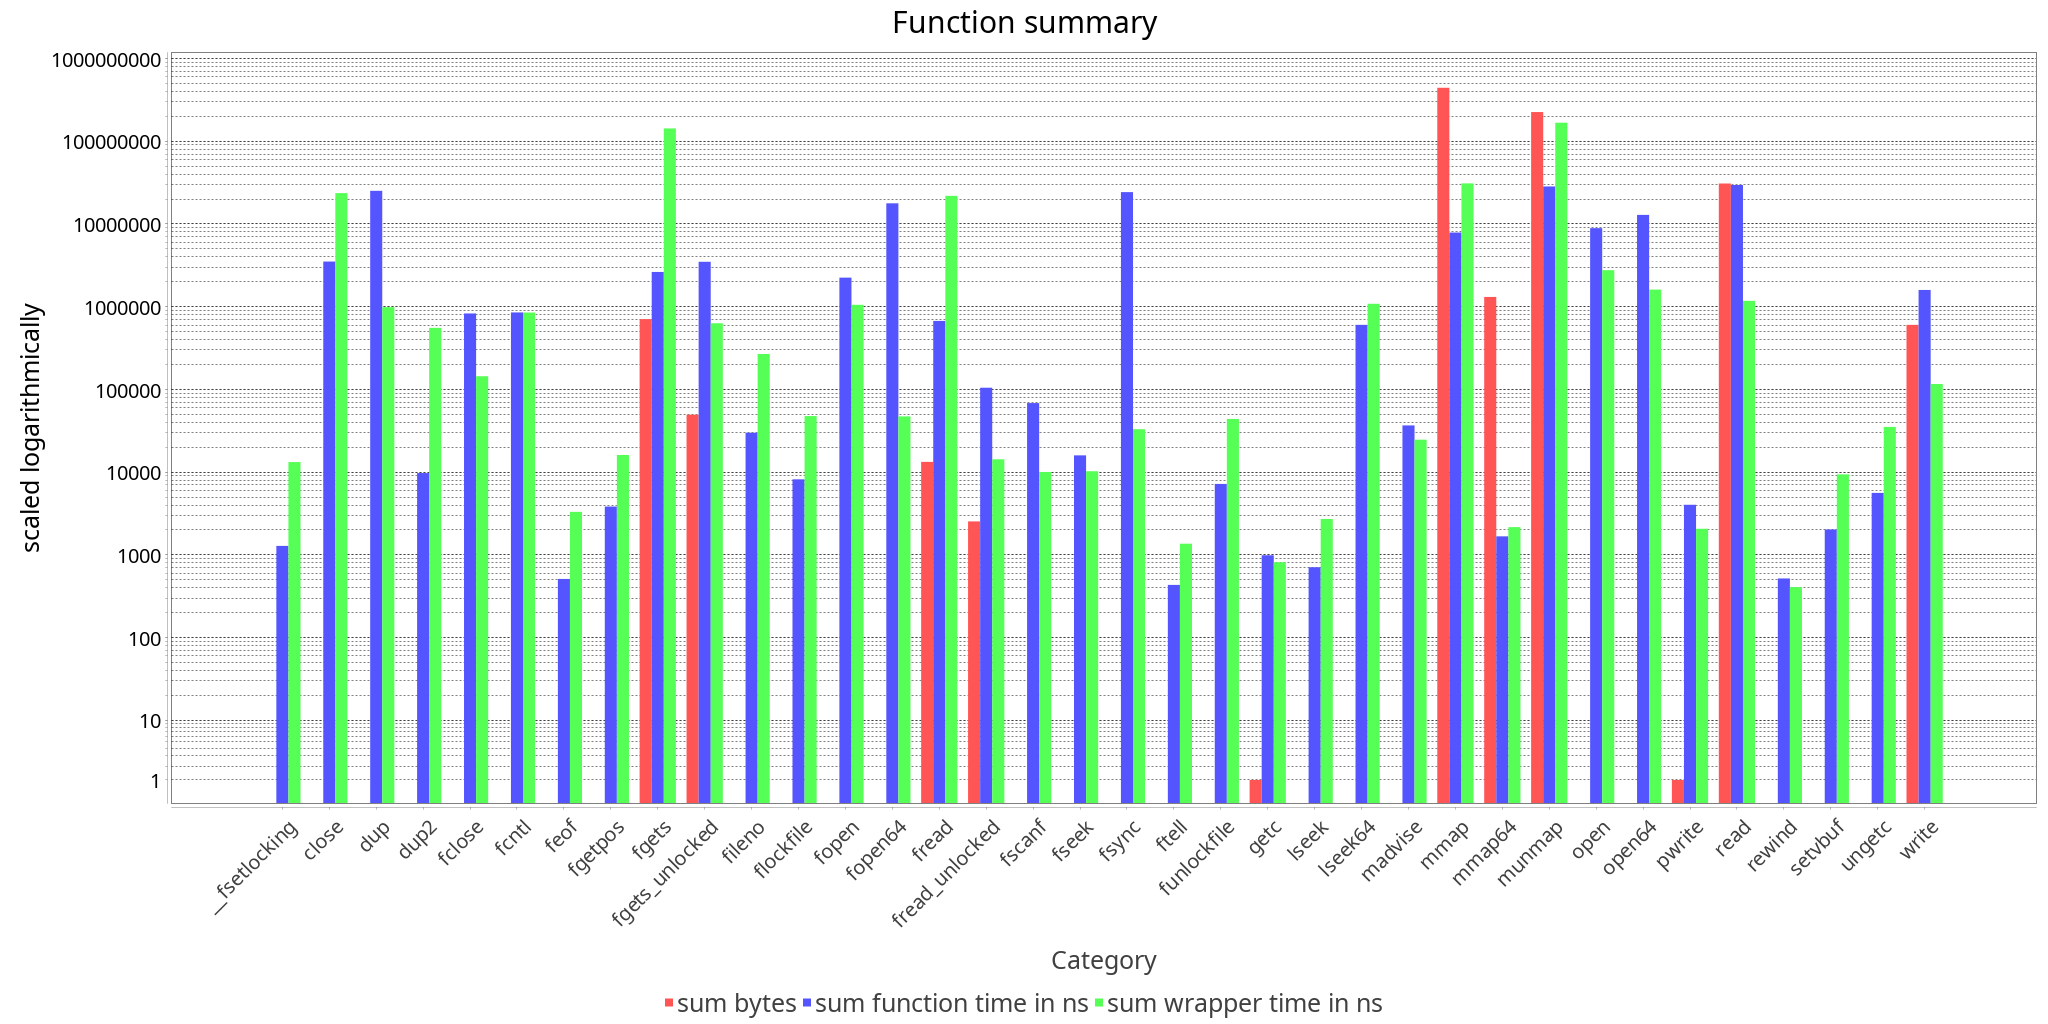
<prefix-for-log-names>_function_summary.png shows a bar chart with one entry for each monitored function. Multiple calls of the same function are summarized. For each function two to three bars are shown. One bar shows the read or written bytes. A other bar shows the time this function has needed in nano seconds. The third bar is optional and only present if the option LOG_WRAPPER_TIME during build of libiotrace was set (see Build libiotrace and ccmake). If the option was given the bar shows the time needed for the wrapper functionality used to monitor the function (this shows the overhead of libiotrace).
The bar chart shows the efficiency of the used functions. A function that uses a lot of time to read or write a few bytes is less efficient than a function that reads or writes more bytes in the same or even less time. So this char shows some optimization potential.
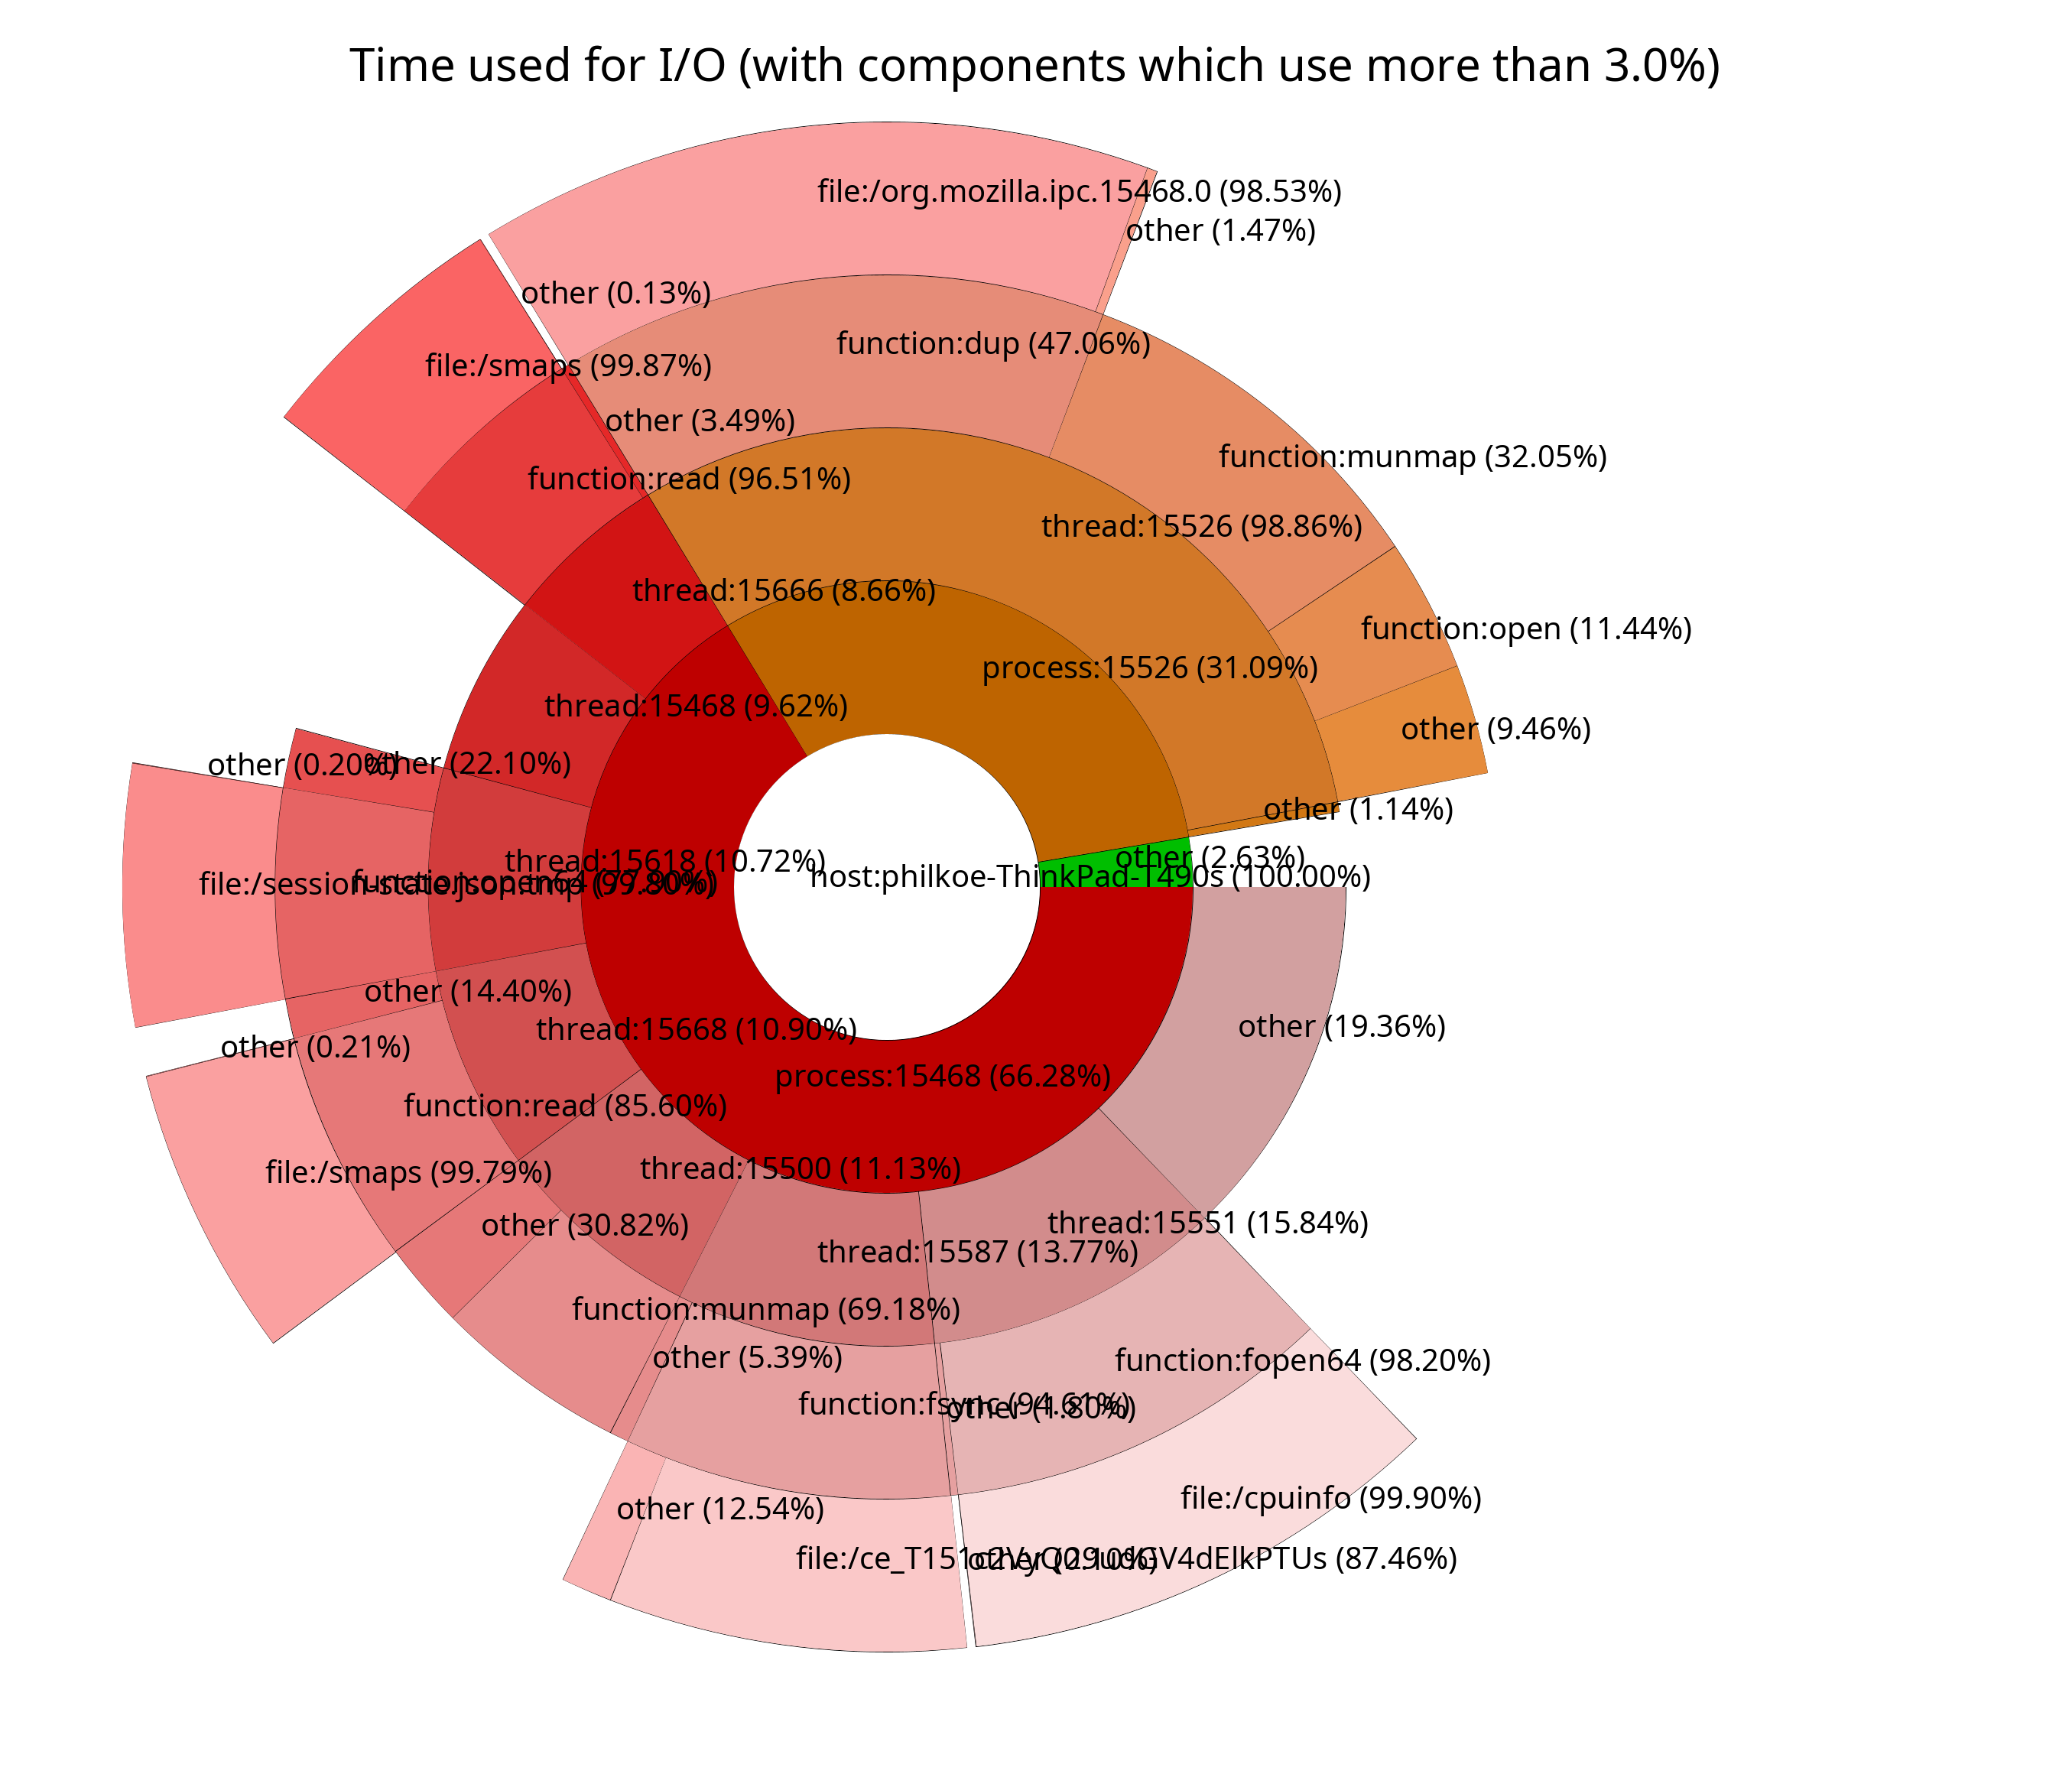
<prefix-for-log-names>_time_pie.png
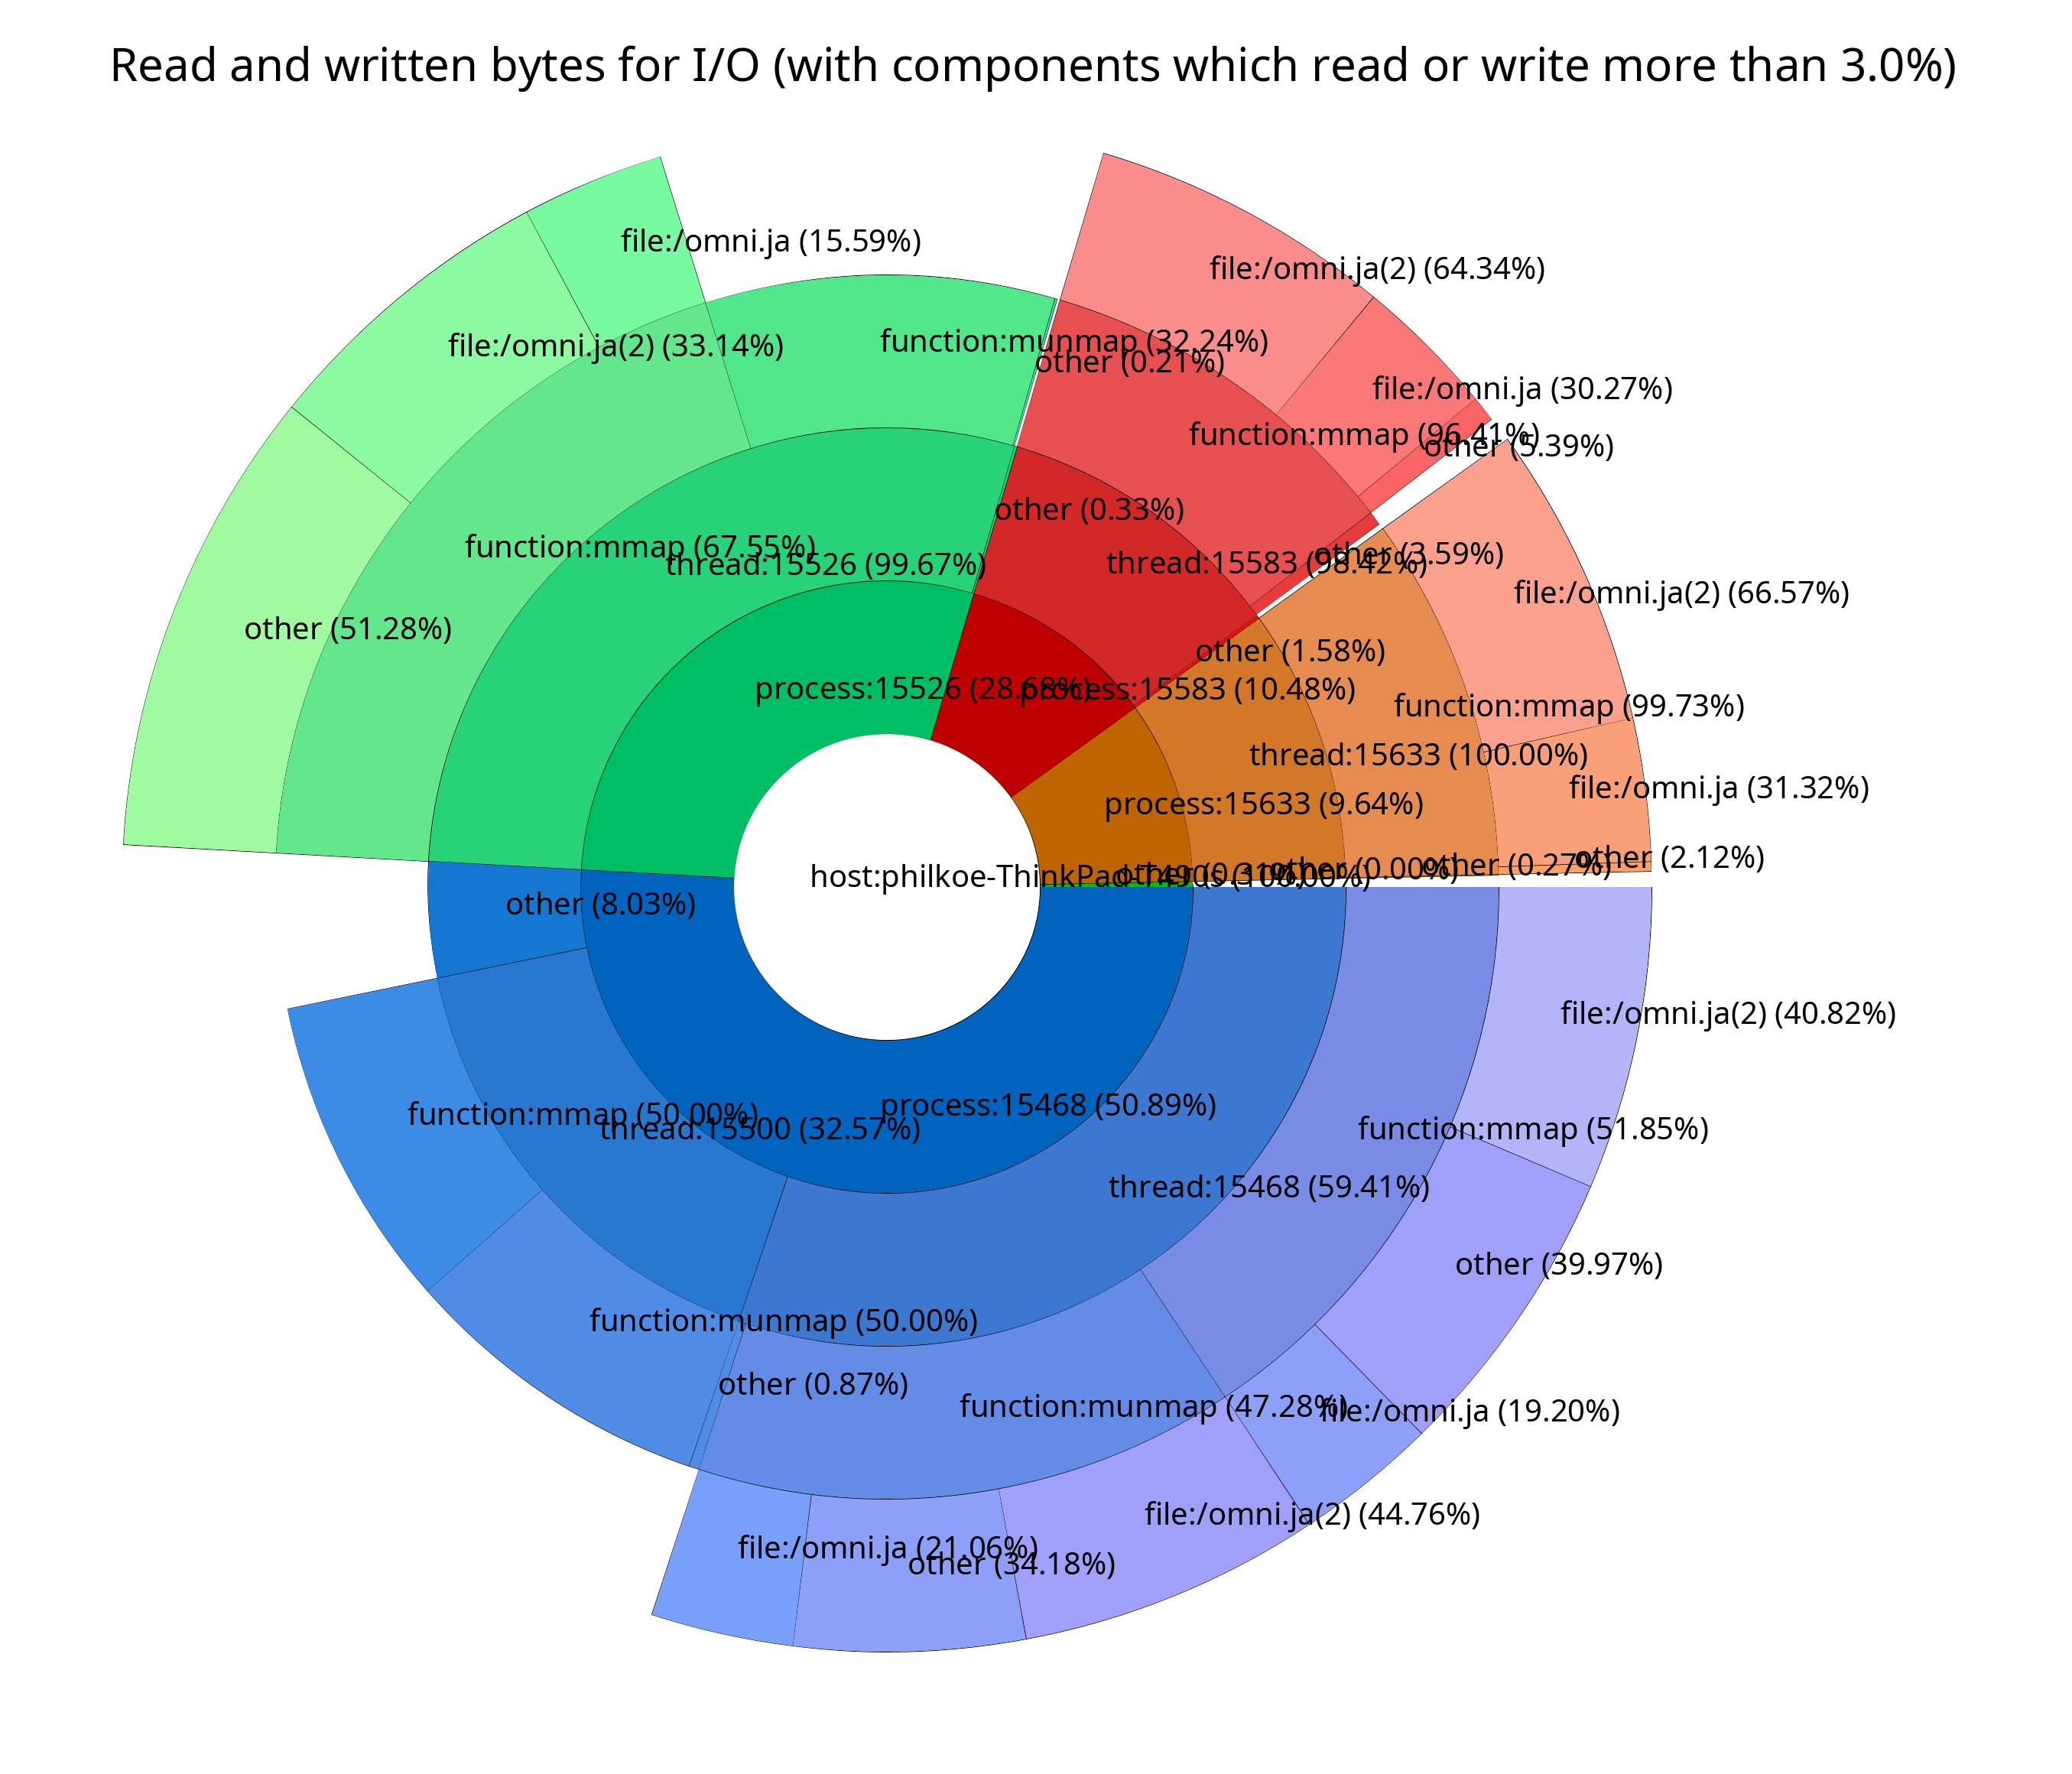
<prefix-for-log-names>_bytes_pie.png
<prefix-for-log-names>_1.mp4
To use Grafana and InfluxDB to trace every function call in real-time and write its values in the databse you have to do the following:
- Go to the fsprj2 root directory
cd libiotrace/buildccmake ..- Turn the option "SENDING" on
cd ../../Live-Tracingdocker-compose up -d
InfluxDB is now available under http://localhost:8086 (username: admin password: test12345678) and grafana under http://localhost:3000 (username: admin password: admin).
Now you can use libiotrace like in the following example to send live data to InfluxDB. The Token is preconfigured with docker-compose and doesn't have to be changed. If you change token, organization name or bucket name you have to reconfigure the data sources in Grafana.
When WITH_POSIX_IO is activated in cmake you can only use IPv4 addresses for IOTRACE_DATABASE_IP. When it is disabled name resolution is possible.
You can use a whitelist to specify which wrappers should be traced when "ALL_WRAPPERS_ACTIVE" in cmake is turned off. You have to create a new file called whitelist in the directory of the program that should be traced. The whitelist file contains in each line the name of exactly one function. This could look like:
MPI_File_open
MPI_File_write
MPI_File_read
fopen
fclose
To trace MPI File-I/O wrappers you have to turn on "WITH_MPI_IO" in ccmake.
mpirun -np 4 -x IOTRACE_LOG_NAME=MPI_read_test2 -x IOTRACE_DATABASE_IP=127.0.0.1 -x IOTRACE_DATABASE_PORT=8086 -x IOTRACE_INFLUX_ORGANIZATION=hse -x IOTRACE_INFLUX_BUCKET=hsebucket -x IOTRACE_INFLUX_TOKEN=OXBWllU1poZotgyBlLlo2XQ_u4AYGYKQmdxvJJeotKRyvdn5mwjEhCXyOjyldpMmNt_9YY4k3CK-f5Eh1bN0Ng== -x IOTRACE_WHITELIST=./whitelist -x LD_PRELOAD=/path/to/libiotrace.so mpi_program_to_be_observed
IOTRACE_LOG_NAME=MPI_read_test2 IOTRACE_DATABASE_IP=127.0.0.1 IOTRACE_DATABASE_PORT=8086 IOTRACE_INFLUX_ORGANIZATION=hse IOTRACE_INFLUX_BUCKET=hsebucket IOTRACE_INFLUX_TOKEN=OXBWllU1poZotgyBlLlo2XQ_u4AYGYKQmdxvJJeotKRyvdn5mwjEhCXyOjyldpMmNt_9YY4k3CK-f5Eh1bN0Ng== IOTRACE_WHITELIST=./whitelist LD_PRELOAD=/path/to/libiotrace.so program_to_be_observed
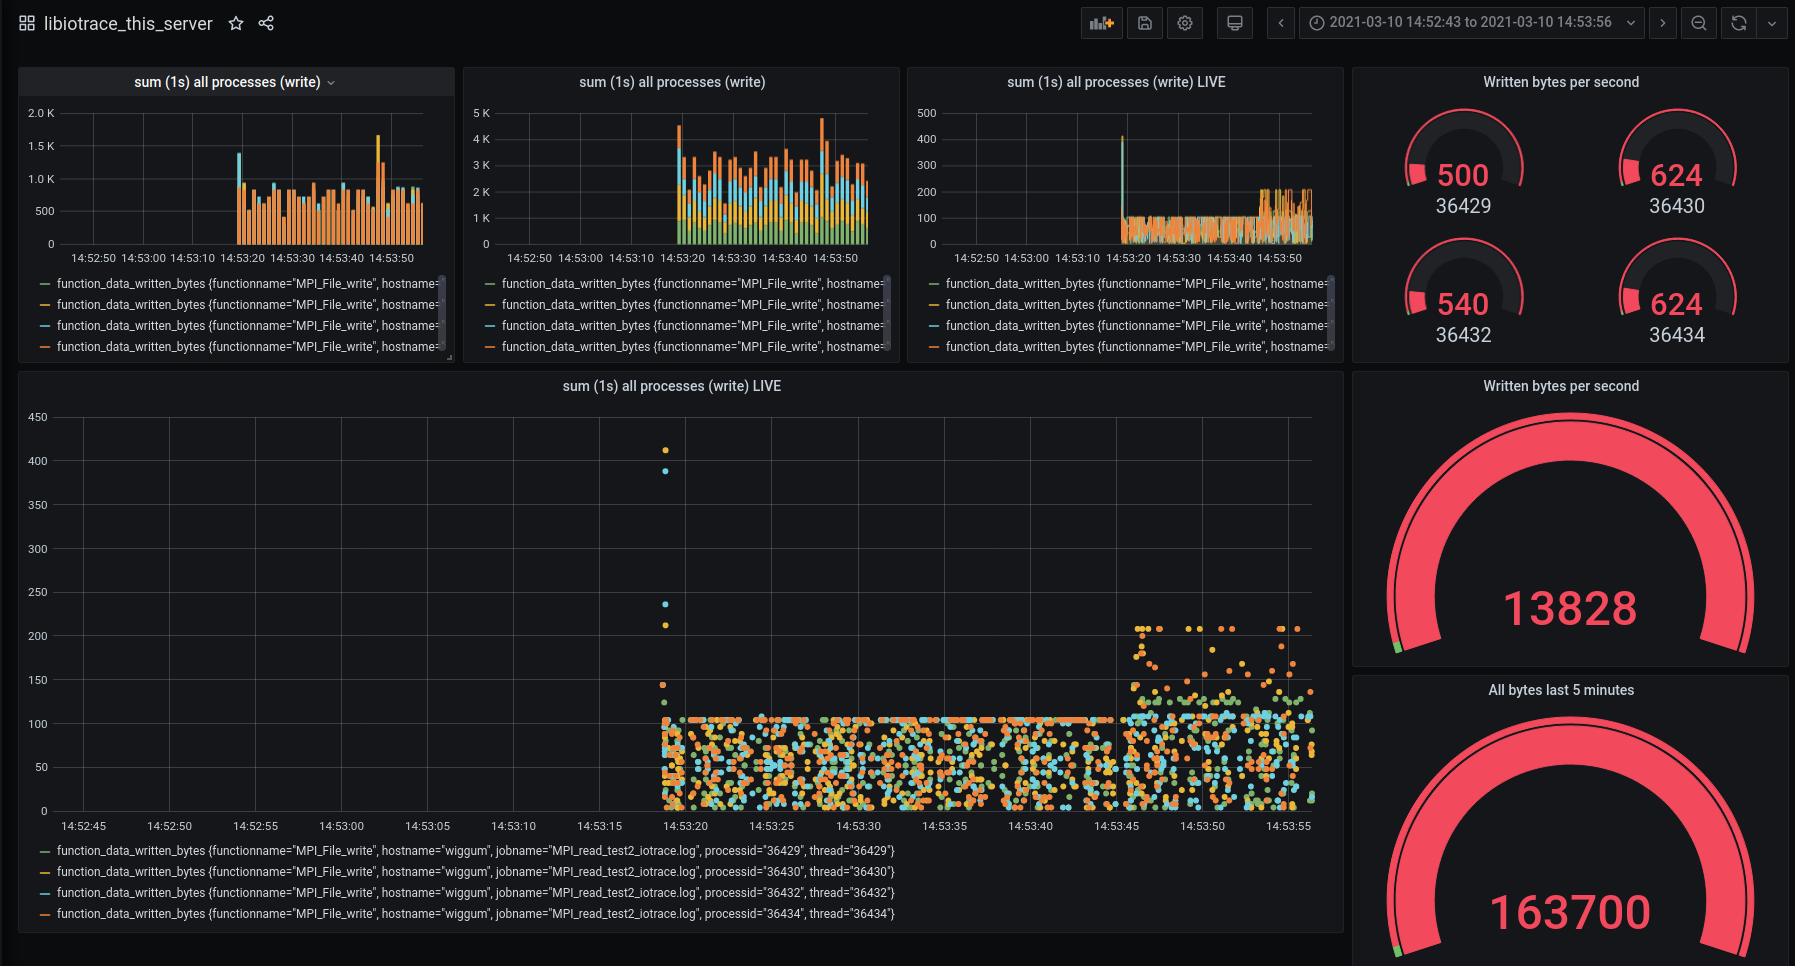
To show the live data from libiotrace in Grafana the Flux query language needs to be used.
from(bucket: "hsebucket")
|> range(start: -5m, stop: now())
|> filter(fn: (r) => r["_measurement"] == "libiotrace")
|> filter(fn: (r) => r["_field"] == "function_data_written_bytes")
|> filter(fn: (r) => r["functionname"] == "MPI_File_write")
|> aggregateWindow(every: 1s, fn: sum, createEmpty: false)
|> yield(name: "sum")
This example will use the measurement libiotrace from the hsebucket and show all bytes written by MPI_File_write in the last 5 minutes. Grafana will show the data of different processes in different colors. Data is aggregated by 1s per process. This can be changed to e.g. 1ms.
When libiotrace is running in Live Tracing mode it is possible to activate and deactivate wrappers at runtime with HTTP. Each process writes its IP addresses and ports in the "MPI_read_test2_control.log" logfile.
With this information HTTP-POST requests can be send to each process. E.g. "172.16.244.1:50003/MPI_Waitall/0" will deactivate the Live-Tracing of "MPI_Waitall" at one process. Sending ""172.16.244.1:50003/MPI_Waitall/1" will reactivate this.
Each process can also send a json list with the current status (active or incactive) of each wrapper. To get this information you have to send a HTTP-GET request to each process like "172.16.244.1:50003".
