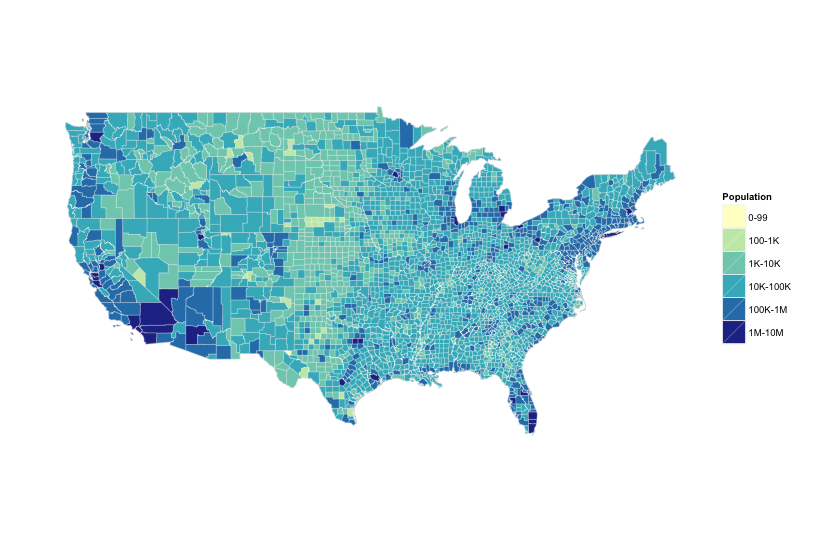
Generate ggplot2 geom_map United States county maps
This is a simple package with two purposes:
- make it easier to generate US County maps (willing to do others if pointed to good shapefiles) with ggplot2 & geom_map
- use more up-to-date shapefiles than what's in the
mapspackage (I mean, it still uses "USSR" for Russia :-)
As some folks have pointed out (and, one main reason I issued the request-for-comments at such an early stage) is that I wanted to gauge the desire for a more geom-oriented/generic way to do county-level mapping than the #spiffy choroplethr package.
After installation, just do:
library(devtools)
install_github("hrbrmstr/ggcounty")
library(ggcounty)

maine <- ggcounty("Maine")
maine$gg
To get:
The maine object in the above code contains
- the
ggggplot2 object - a
mapobject which is a "fortified" data frame - a
county.namesobject which is a list of all county names (or FIPS codes) in that county - a
geom_mapobject (geom) for the state county map
Here is an example of the structure (truncated for brevity):
> str(maine)
List of 4
 $ map         :'data.frame':	724 obs. of  7 variables:
  ..$ long : num [1:724] -70 -70 -70 -70 -70 ...
  ..$ lat  : num [1:724] 44.1 44.1 44 44 44 ...
  ..$ order: int [1:724] 1 2 3 4 5 6 7 8 9 10 ...
  ..$ hole : logi [1:724] FALSE FALSE FALSE FALSE FALSE FALSE ...
  ..$ piece: Factor w/ 2 levels "1","2": 1 1 1 1 1 1 1 1 1 1 ...
  ..$ group: Factor w/ 18 levels "Androscoggin.1",..: 1 1 1 1 1 1 1 1 1 1 ...
  ..$ id   : chr [1:724] "Androscoggin" "Androscoggin" "Androscoggin" "Androscoggin" ...
 $ county.names: chr [1:16] "Androscoggin" "Aroostook" "Cumberland" "Franklin" ...
 $ gg          :List of 9
  ..$ data       : list()
  .. ..- attr(*, "class")= chr "waiver"
  ..$ layers     :List of 1
  .. ..$ :Classes 'proto', 'environment' <environment: 0x7f8cbe7292d8>
  ..$ scales     :Reference class 'Scales' [package "ggplot2"] with 1 fields
  .. ..$ scales: list()
  .. ..and 21 methods, of which 9 are possibly relevant:
  .. ..  add, clone, find, get_scales, has_scale, initialize, input, n, non_position_scales
  ..$ mapping    : list()
  ..$ theme      :List of 7
  .. ..$ plot.background :List of 4
  .. .. ..$ fill    : chr "transparent"
  .. .. ..$ colour  : logi NA
  .. .. ..$ size    : NULL
  .. .. ..$ linetype: NULL
  .. .. ..- attr(*, "class")= chr [1:2] "element_rect" "element"
  .. ..$ panel.border    : list()
  .. .. ..- attr(*, "class")= chr [1:2] "element_blank" "element"
  .. ..$ panel.background:List of 4
  .. .. ..$ fill    : chr "transparent"
  .. .. ..$ colour  : logi NA
  .. .. ..$ size    : NULL
  .. .. ..$ linetype: NULL
  .. .. ..- attr(*, "class")= chr [1:2] "element_rect" "element"
  .. ..$ panel.grid      : list()
  .. .. ..- attr(*, "class")= chr [1:2] "element_blank" "element"
  .. ..$ axis.text       : list()
  .. .. ..- attr(*, "class")= chr [1:2] "element_blank" "element"
  .. ..$ axis.ticks      : list()
  .. .. ..- attr(*, "class")= chr [1:2] "element_blank" "element"
  .. ..$ legend.position : chr "right"
  .. ..- attr(*, "class")= chr [1:2] "theme" "gg"
  .. ..- attr(*, "complete")= logi FALSE
  ..$ coordinates:List of 4
  .. ..$ projection : chr "mercator"
  .. ..$ orientation: NULL
  .. ..$ limits     :List of 2
  .. .. ..$ x: NULL
  .. .. ..$ y: NULL
  .. ..$ params     : list()
  .. ..- attr(*, "class")= chr [1:2] "map" "coord"
  ..$ facet      :List of 1
  .. ..$ shrink: logi TRUE
  .. ..- attr(*, "class")= chr [1:2] "null" "facet"
  ..$ plot_env   :<environment: R_GlobalEnv>
  ..$ labels     :List of 3
  .. ..$ x     : chr ""
  .. ..$ y     : chr ""
  .. ..$ map_id: chr "id"
  ..- attr(*, "class")= chr [1:2] "gg" "ggplot"
 $ geom        :Classes 'proto', 'environment' <environment: 0x7f8cbf7b5f58>
This lets you add further map layers (e.g. for a choropleth):
library(ggcounty)

# built-in US population by FIPS code data set
data(population)

# define appropriate (& nicely labeled) population breaks
population$brk <- cut(population$count,
                      breaks=c(0, 100, 1000, 10000, 100000, 1000000, 10000000),
                      labels=c("0-99", "100-1K", "1K-10K", "10K-100K",
                               "100K-1M", "1M-10M"),
                      include.lowest=TRUE)

# get the US counties map (lower 48)
us <- ggcounty.us()

# start the plot with our base map
gg <- us$g

# add a new geom with our population (choropleth)
gg <- gg + geom_map(data=population, map=us$map,
                    aes(map_id=FIPS, fill=brk),
                    color="white", size=0.125)

# define nice colors
gg <- gg + scale_fill_manual(values=c("#ffffcc", "#c7e9b4", "#7fcdbb",
                                      "#41b6c4", "#2c7fb8", "#253494"),
                             name="Population")

# plot the map
gg
And, combining individual maps is pretty straightforward:
ny <- ggcounty("New York", fill="#c7e9b4", color="white")
nj <- ggcounty("New Jersey", fill="#41b6c4", color="white")
pa <- ggcounty("Pennsylvania", fill="#253494", color="white")

ny$gg + nj$geom + pa$geom
or have the county names/FIPS codes as a quick reference or for verifitcation.
> ny$county.names
 [1] "Albany"       "Allegany"     "Bronx"        "Broome"       "Cattaraugus"  "Cayuga"
 [7] "Chautauqua"   "Chemung"      "Chenango"     "Clinton"      "Columbia"     "Cortland"
[13] "Delaware"     "Dutchess"     "Erie"         "Essex"        "Franklin"     "Fulton"
[19] "Genesee"      "Greene"       "Hamilton"     "Herkimer"     "Jefferson"    "Kings"
[25] "Lewis"        "Livingston"   "Madison"      "Monroe"       "Montgomery"   "Nassau"
[31] "New York"     "Niagara"      "Oneida"       "Onondaga"     "Ontario"      "Orange"
[37] "Orleans"      "Oswego"       "Otsego"       "Putnam"       "Queens"       "Rensselaer"
[43] "Richmond"     "Rockland"     "Saratoga"     "Schenectady"  "Schoharie"    "Schuyler"
[49] "Seneca"       "St. Lawrence" "Steuben"      "Suffolk"      "Sullivan"     "Tioga"
[55] "Tompkins"     "Ulster"       "Warren"       "Washington"   "Wayne"        "Westchester"
[61] "Wyoming"      "Yates"

