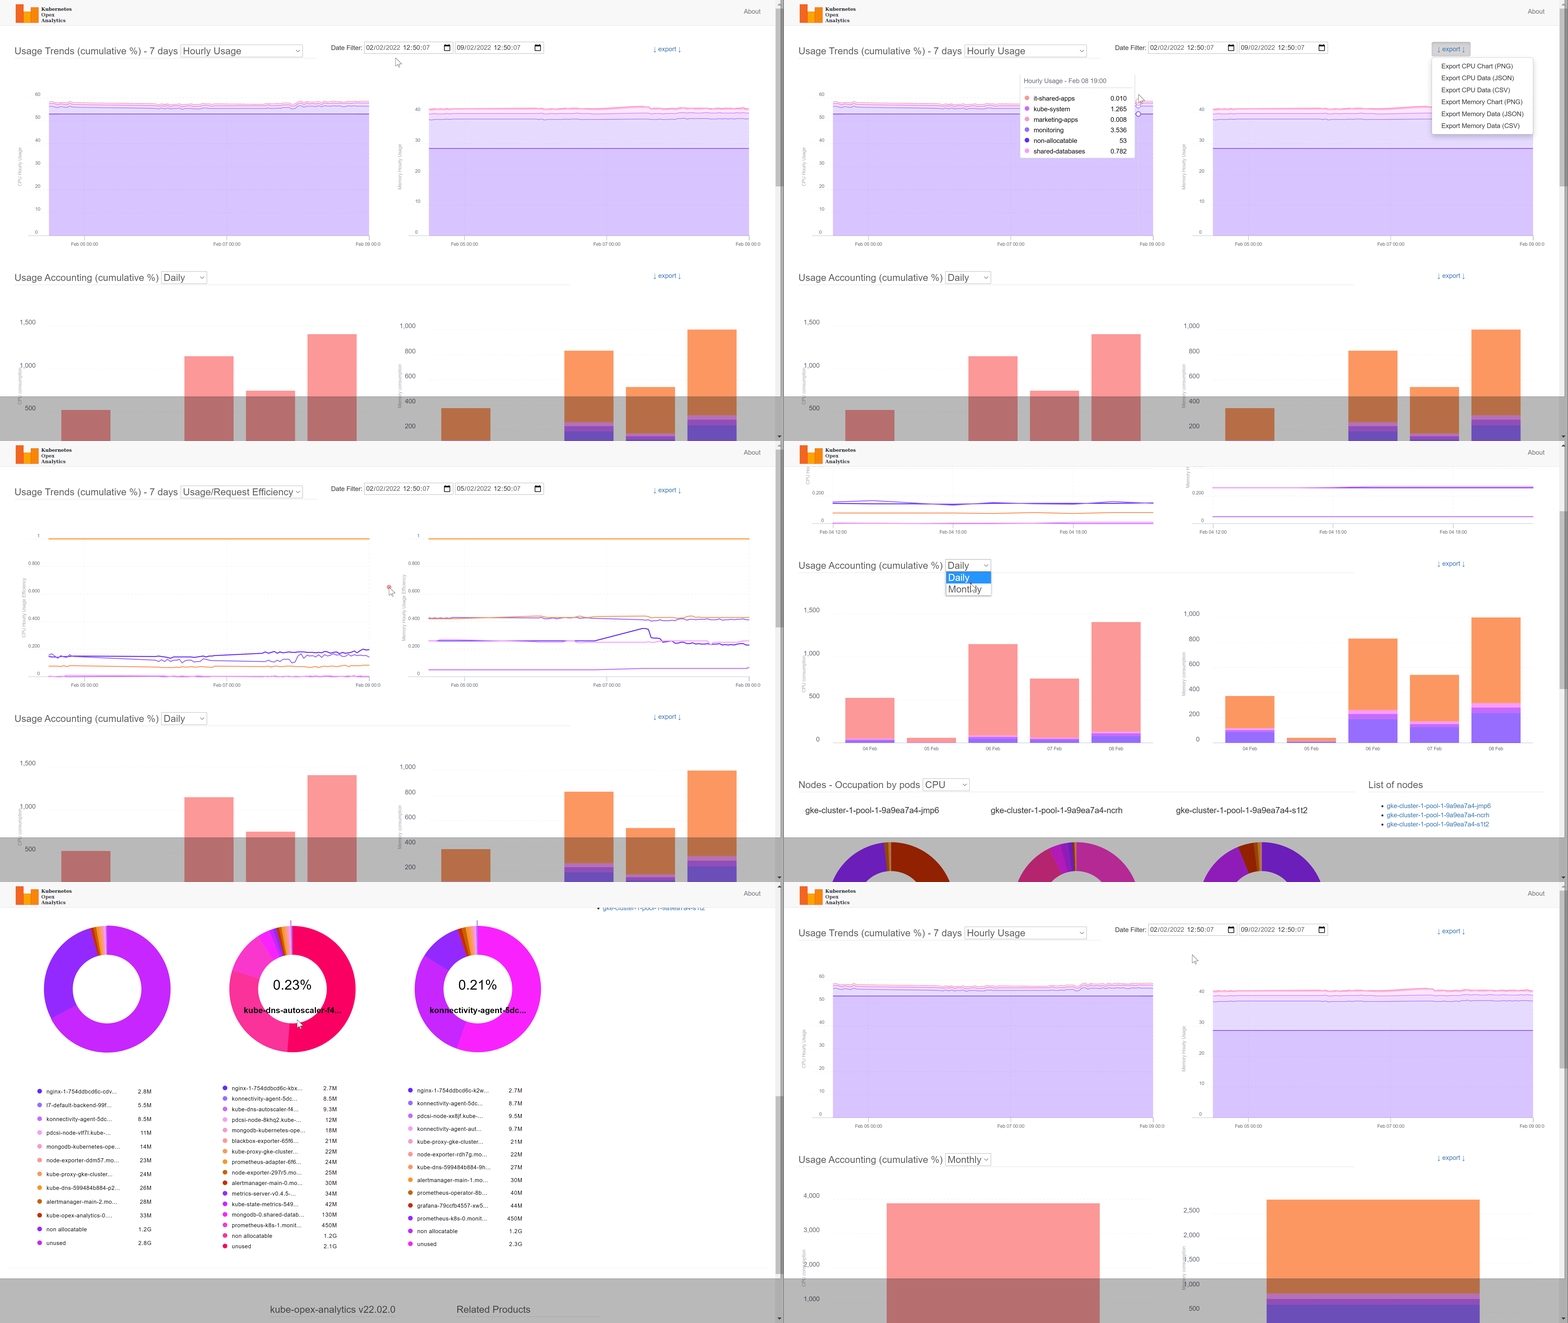
kube-opex-analytics (literally Kubernetes Opex Analytics) is a Kubernetes usage accounting and analytics tool to help organizations track the resources being consumed by their Kubernetes clusters over time (hourly, daily, monthly). The purpose of kube-opex-analytics is to help prevent overpaying. Indeed, it provides insightful usage analytics metrics and charts, that engineering and financial teams can use as key indicators to take appropriate cost optimization decisions.
Key features:
- Hourly consumption trends, daily and monthly accounting per namespace. This feature provides analytics metrics tracking both actual usage and requested capacities over time. Metrics are namespaced-based, collected every 5 minutes, consolidated on a hourly basis for trends, from which daily and monthly accounting is processed.
- Accounting of non-allocatable capacities. At node and cluster levels,
kube-opex-analyticstracks and consolidates the share of non-allocatable capacities and highlights them against usable capacities (i.e. capacities used by actual application workloads). In contrary to usable capacities, non-allocatable capacities are dedicated to Kubernetes operations (OS, kubelets, etc). - Cluster usage accounting and capacity planning. This feature makes it easy to account and visualize capacities consumed on a cluster, globally, instantly and over time.
- Usage/requests efficiency. Based on hourly-consolidated trends, this functionality helps know how efficient resource requests set on Kubernetes workloads are, compared against the actual resource usage over time.
- Cost allocation and charge back analytics: automatic processing and visualization of resource usage accounting per namespace on daily and monthly periods.
- Insightful and extensible visualization.
kube-opex-analyticsenables built-in analytics dashboards, as well as a native Prometheus exporter that exposes its analytics metrics for third-party visualization tools like Grafana.
Read the design fundamentals documentation to learn more concepts and implementation decisions.
Multi-cluster Integration:
kube-opex-analyticstracks the usage for a single Kubernetes cluster. For a centralized multi-Kubernetes usage analytics, use our Krossboard Kubernetes Operator product. Watch a demo video.
- Installation on Kubernetes
- Installation on Docker
- Built-in dashboards and charts
- Prometheus Exporter and Grafana Dashboards
- Configuration Settings
Checkout the Design Fundamentals documentation to learn more about kube-opex-analytics, it introduces concepts and implementation decisions.
kube-opex-analytics (code and documentation) is licensed under the terms of Apache License 2.0; read the LICENSE. Besides, it's bound to third-party libraries each with its specific license terms; read the NOTICE for additional information.
We encourage feedback and always make our best to handle any troubles you may encounter when using kube-opex-analytics.
Use this link to submit issues or improvement ideas.
To contribute bug patches or new features, please submit a Pull Request.
Contributions are accepted subject that the code and documentation be released under the terms of Apache 2.0 License.


