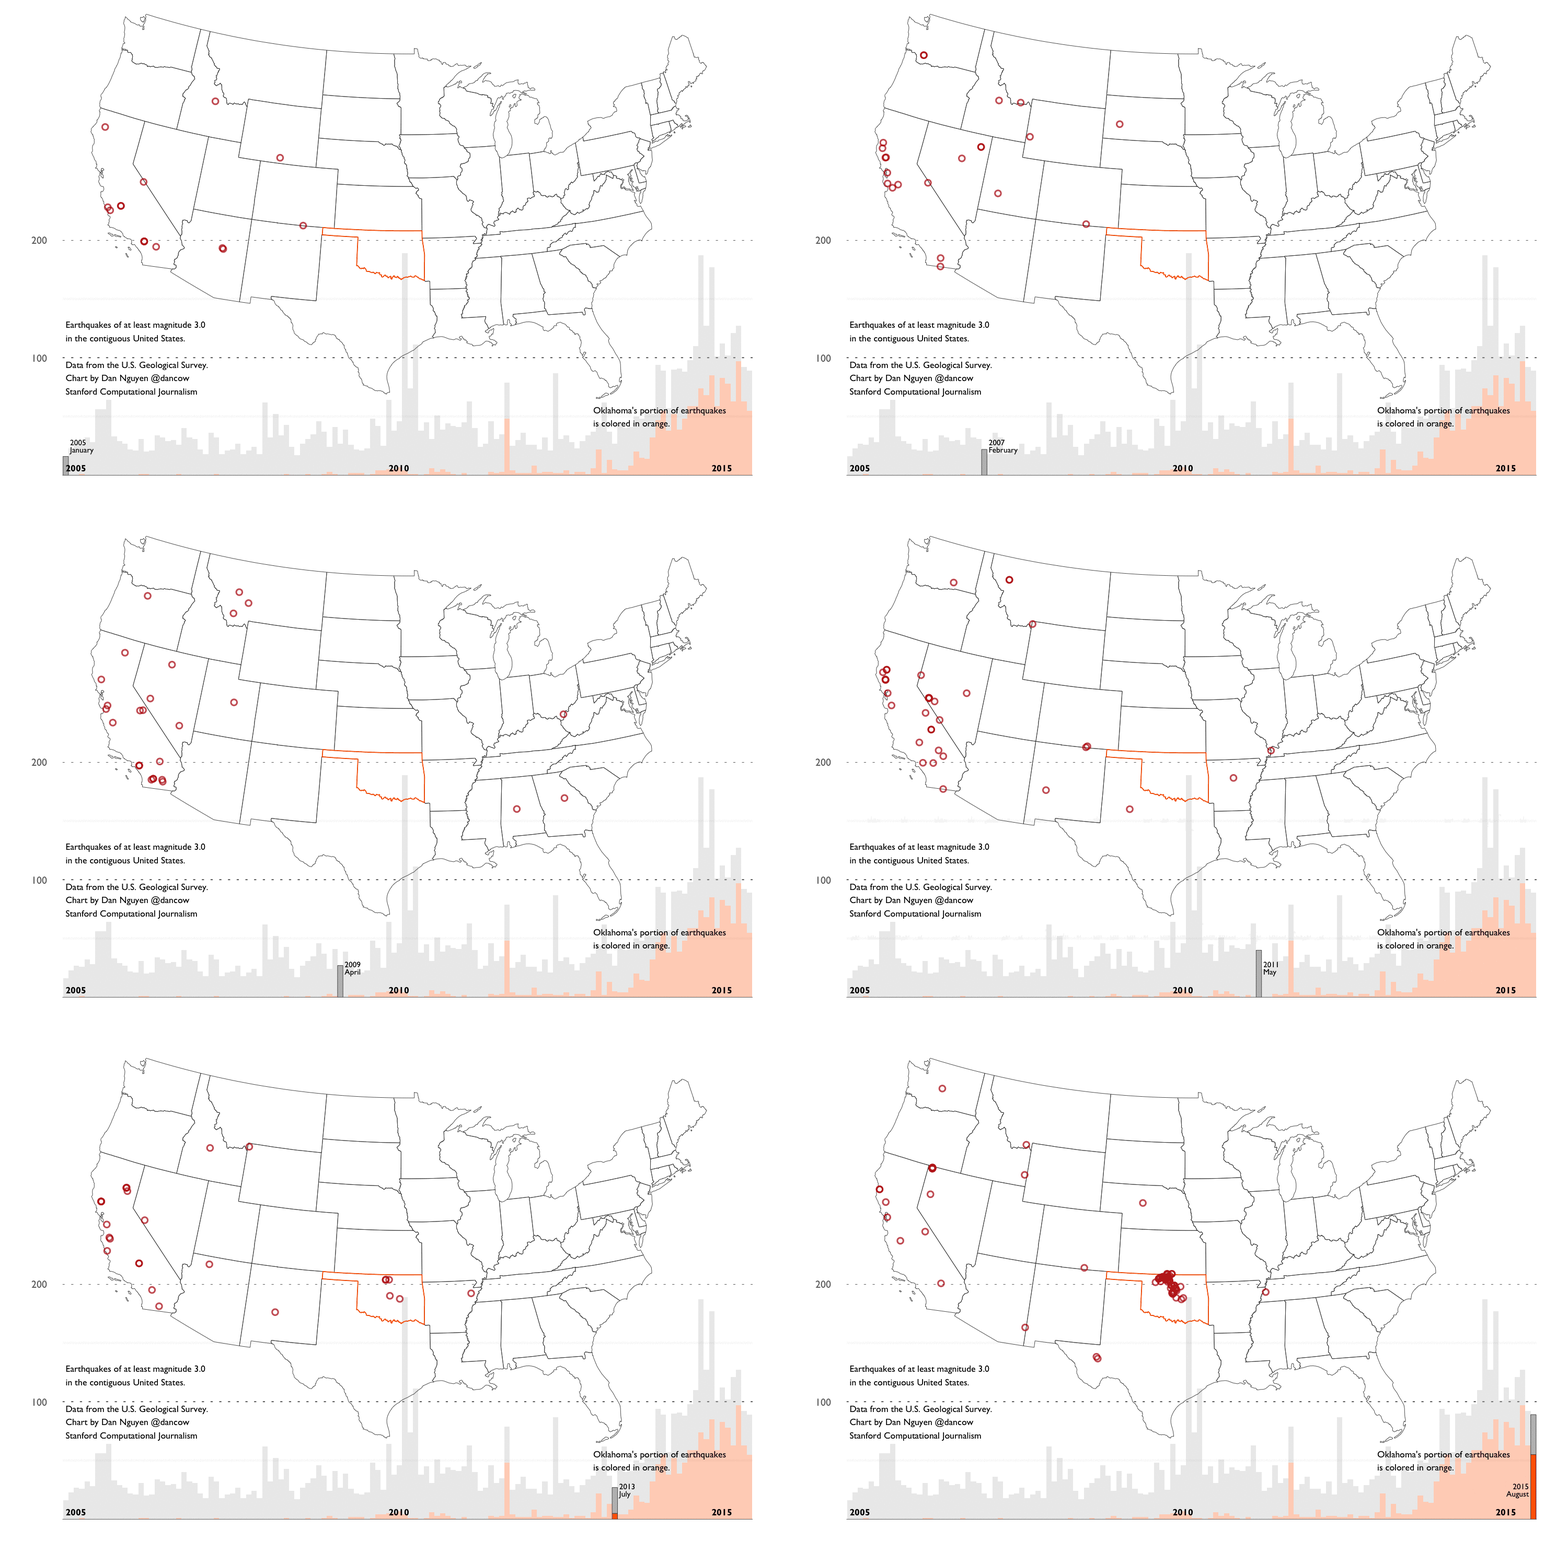
An R Notebook using ggplot2 and rgdal, among other libraries to examine the surge in Oklahoma earthquakes.
By Dan Nguyen for Stanford Computational Journalism.
Write up is in progress. But here's an animated GIF I made, painstakingly created via R and ImageMagick and shell-fu:
The R notebooks use absolute paths for their cache directories, e.g. /tmp/rstudio-cache/ok-earthquakes. If you're on a Windows system, you'll likely have to change all of these to whatever Windows' equivalent to /tmp is.
