In the directory of markdown file, right-click in empty space, choose Open with Code (Visual Studio Code required), open markdown file in left sidebar (EXPLORER), then use shortcut Ctrl + Shift + V to open markdown previewer.
- In start menu, open Anaconda Prompt
- Switch path to your code directory (e.g.,
cd D:\pig) - Launch Jupyter Notebook with command
jupyter notebook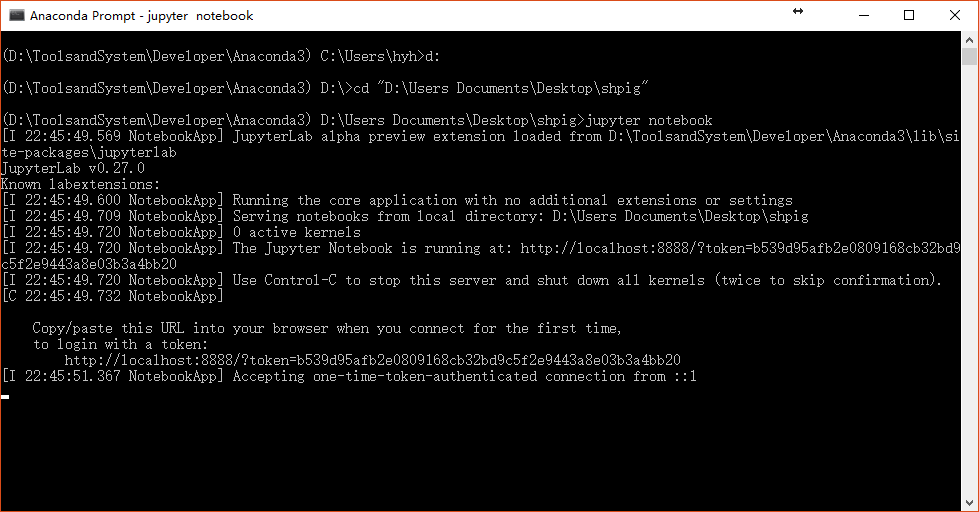
- Open
plot.ipynbto continue your homework

Python has its own code style. So-called Pythonic code is the code in Python code style. A pythonic code includes 2 parts:
One is format style. For example, two blank lines are required between two method definition:
# correct
def foo():
    pass


def foobar():
    pass
# wrong
def foo():
pass
def foobar():
passThanks to PyCharm, you no longer need to read the boring official documentation in code style. PyCharm offers powerful formatting tools for you to format your code automatically. What you need to do is just press Alt + F8, then your code will be formatted in standard python style. Remember Alt + Enter is also your friend when your code is underlined.
The other one is code style. For example, you do something like this in C-like programming language when you change the value of two variables a and b:
int temp = a;
a = b;
b = temp;
The pythonic code only needs one line:
b, a = a, bIn this extra homework, you are required to use Alt + Enter and Alt + F8 to clean your code when PyCharm underlines your future code. Try to avoid wave lines in your code.
In this homework, you are required to predict the piggy price on Shanghai Piggy Dataset.
To simplify the model, Linear Regression will be applied to the dataset. Feel free to explore any complex model although I believe you will not. Linear Regression means you want the output
Almost all algorithms accept the numerical matrix as input. Since there is a time column in Shanghai Piggy Dataset, convert it to numerical data is necessary. About time transforming, see Appendix I.
In this part, NumPy array will be used to represent a numerical matrix. There is a brief introduction of NumPy in Appendix II.
Finish normalize method in prediction.py. Then run check code in prediction.py:
if __name__ == '__main__':
    Checker.normalization_check()
If everything goes well, you will see
Normalization test passed.
in console output.
How to transform a time string to a number? An intuitive approach is converting directly, e.g., "1970-01-01" to 19700101. One obvious problem is, if there is not a zero padding before month and date, e.g., "1970-1-1" and "1969-12-12", the transforming result comes to 197011 and 19691212. However, 19691212 is greater than 197011, which is not good.
Another solution is Unix Timestamp, which defined as the number of seconds that have elapsed since 00:00:00 Coordinated Universal Time (UTC), Thursday, 1 January 1970. Pandas has built-in method to convert datetime to timestamp.
There must be many many other solutions. Feel free to choose what you like.
Matrix occupies a very important position in data analysis. Almost all different data should be converted to a matrix before fed into algorithms. You must remember a powerful matrix processing tools called MATLAB™. However, MATLAB™ is not free and its compatibility with Python is not good.
In Python, there is an alternative called NumPy, which is often described as MATLAB in Python.
import numpy as np

# create numpy array with builtin function
a = np.arange(16)
a = a.reshape((4, 4))  # reshape to a square matrix
print(a)

# choose a part
print(a[1:3, 0:2])

# create numpy array from python list
b = np.array([1, 2, 3, 4])
print(b)

# add with broadcast
print(a + b)

# stack arrays
# relative method: np.vstack() np.hstack() np.stack()
# i.e., stack vertically \ stack horizontally
print(np.vstack((a, b)))
Related reference:
You will see some appendix in following homework. They often contain some tutorials about packages you might use in the homework. These contents are totally optional, feel free to ignore them.
In this part, you're required to use the Linear Regression model to fit the Shanghai Piggy Dataset.
Finish train() method in prediction.py. Then run check code:
if __name__ == '__main__':
    Checker.predict_check()
If everything goes well, you will see
Training test passed.
and linear regression coefficient.
The tool will be used for prediction is scikit-learn, or sklearn.
Here is an example to fit a linear function
from sklearn import linear_model
import numpy as np

reg = linear_model.Ridge()
x = np.arange(1e3)
y = 0.5 * x
x = x.reshape(-1, 1) # the parameter x of the fit method should be an 2-d array
reg.fit(x, y)
print(reg.coef_)
# expected output:
# [ 0.49999999]Build the model is the very first step in data analysis. The first version of your model always has a bad performance. The most challenging thing in data analysis is testing and tuning your model again and again, and finally get a satisfactory model.
Visualization is always useful in data analysis. In this part, you're required to test your model and visualize the result.
There're serval steps to train and use your model:
- Read in data from files, you should call
readin_data()indataReader. - Split data to training part and testing part, relative method is
split_data()inprediction - Normailze data, method
normalize()inpredictionshould be useful. - Train your model using
train()inpredictionwith training data - Predict price use
prediction.predict()
Your task is finish prediction.test_model() and run prediction.py to visualize the final result.